

INTRODUCTION
Welcome, Q Report readers, to our analysis of the Victoria real estate market for the first quarter of 2026. After a year of recalibration in 2025, Q1 2026 opened with the market finding its footing in seasonal patterns while navigating a backdrop of broader economic uncertainty. The defining theme of the quarter is resilience with caution: prices held firm or improved across all three segments, inventory began its seasonal spring climb, and listing discounts tightened meaningfully from Q4 2025’s elevated levels — a sign that pricing accuracy is improving on both sides of the table.
The frenetic urgency of Victoria’s peak market years remains firmly behind us, but Q1’s data suggests a market that is more efficient, not necessarily weaker. Properties priced to reflect current conditions are moving, while aspirationally priced listings continue to accumulate days on market. With the spring season now underway, Q2 2026 will be the true measure of where buyer demand stands — and early signals are worth watching closely.
MARKET BREAKDOWN
Overview
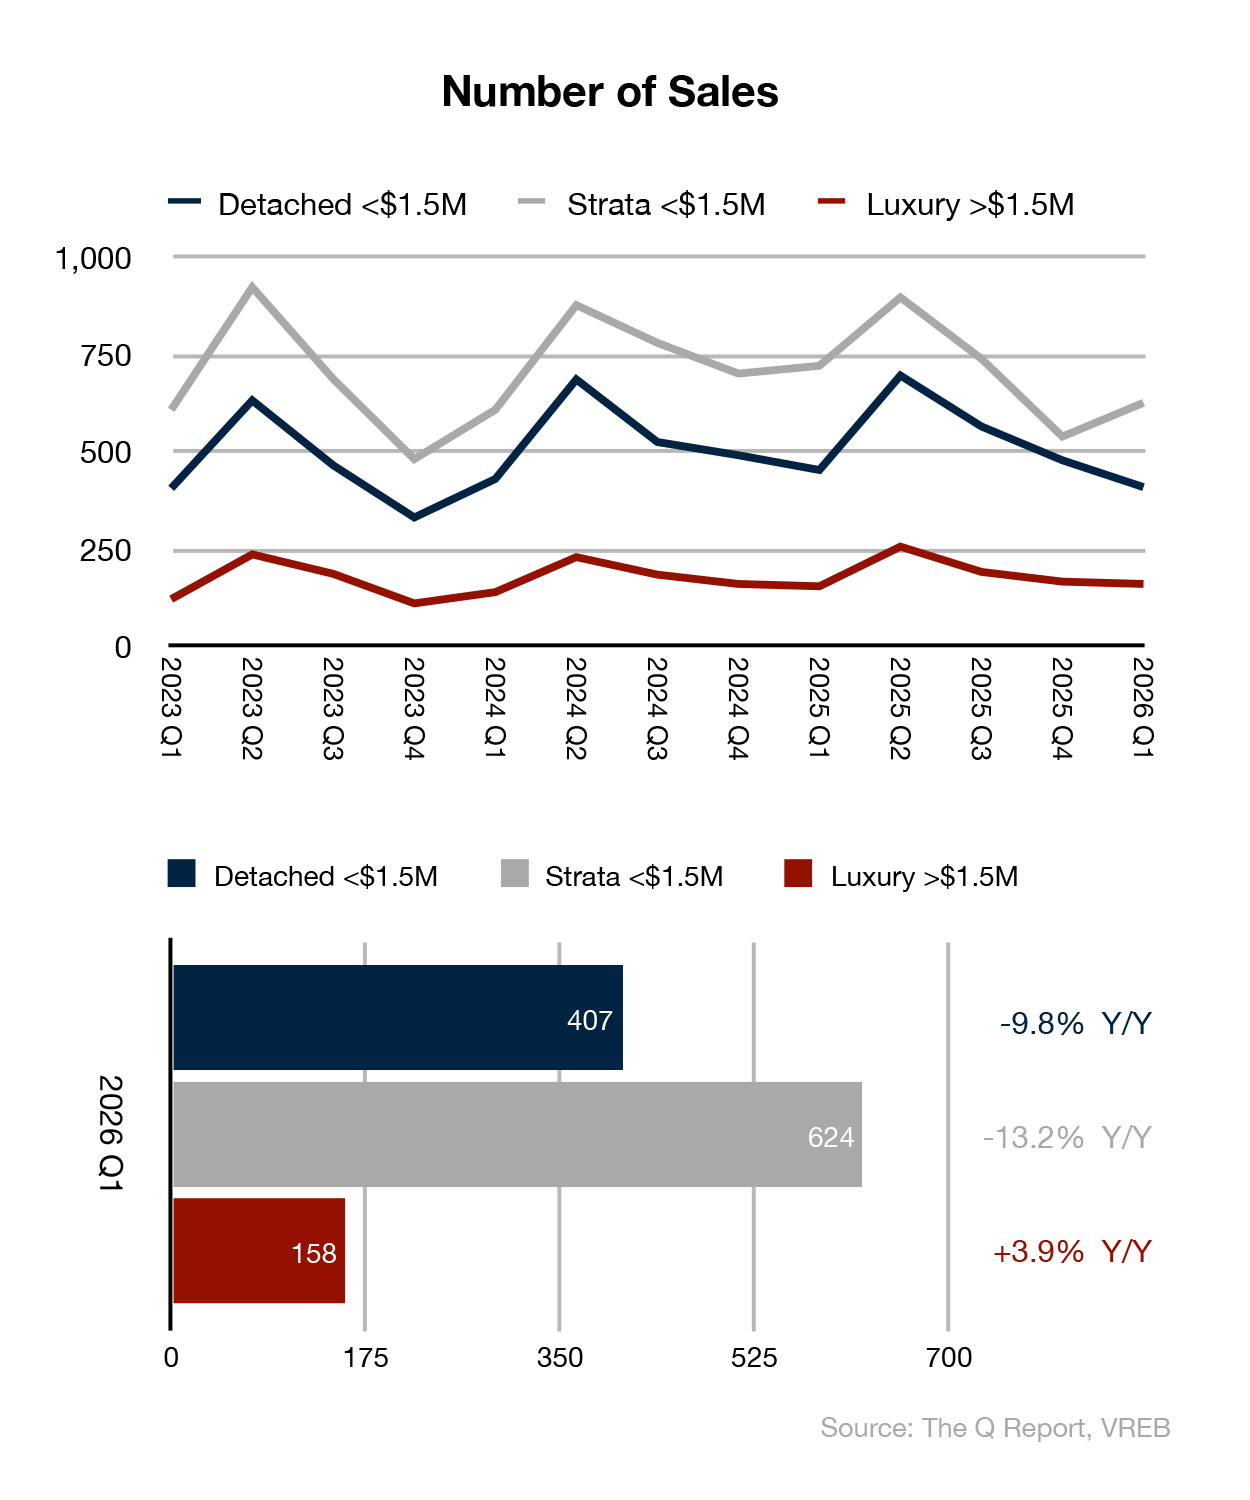
- Sales Volumes Soften Year-Over-Year: Both the Detached (<$1.5M) and Strata (<$1.5M) segments saw year-over-year sales declines of -9.8% and -13.2%, respectively. Seasonal Q/Q changes were mixed — Detached fell -14.5% from Q4 (typical for Q1), while Strata bounced +16.2% as the spring market began to stir.
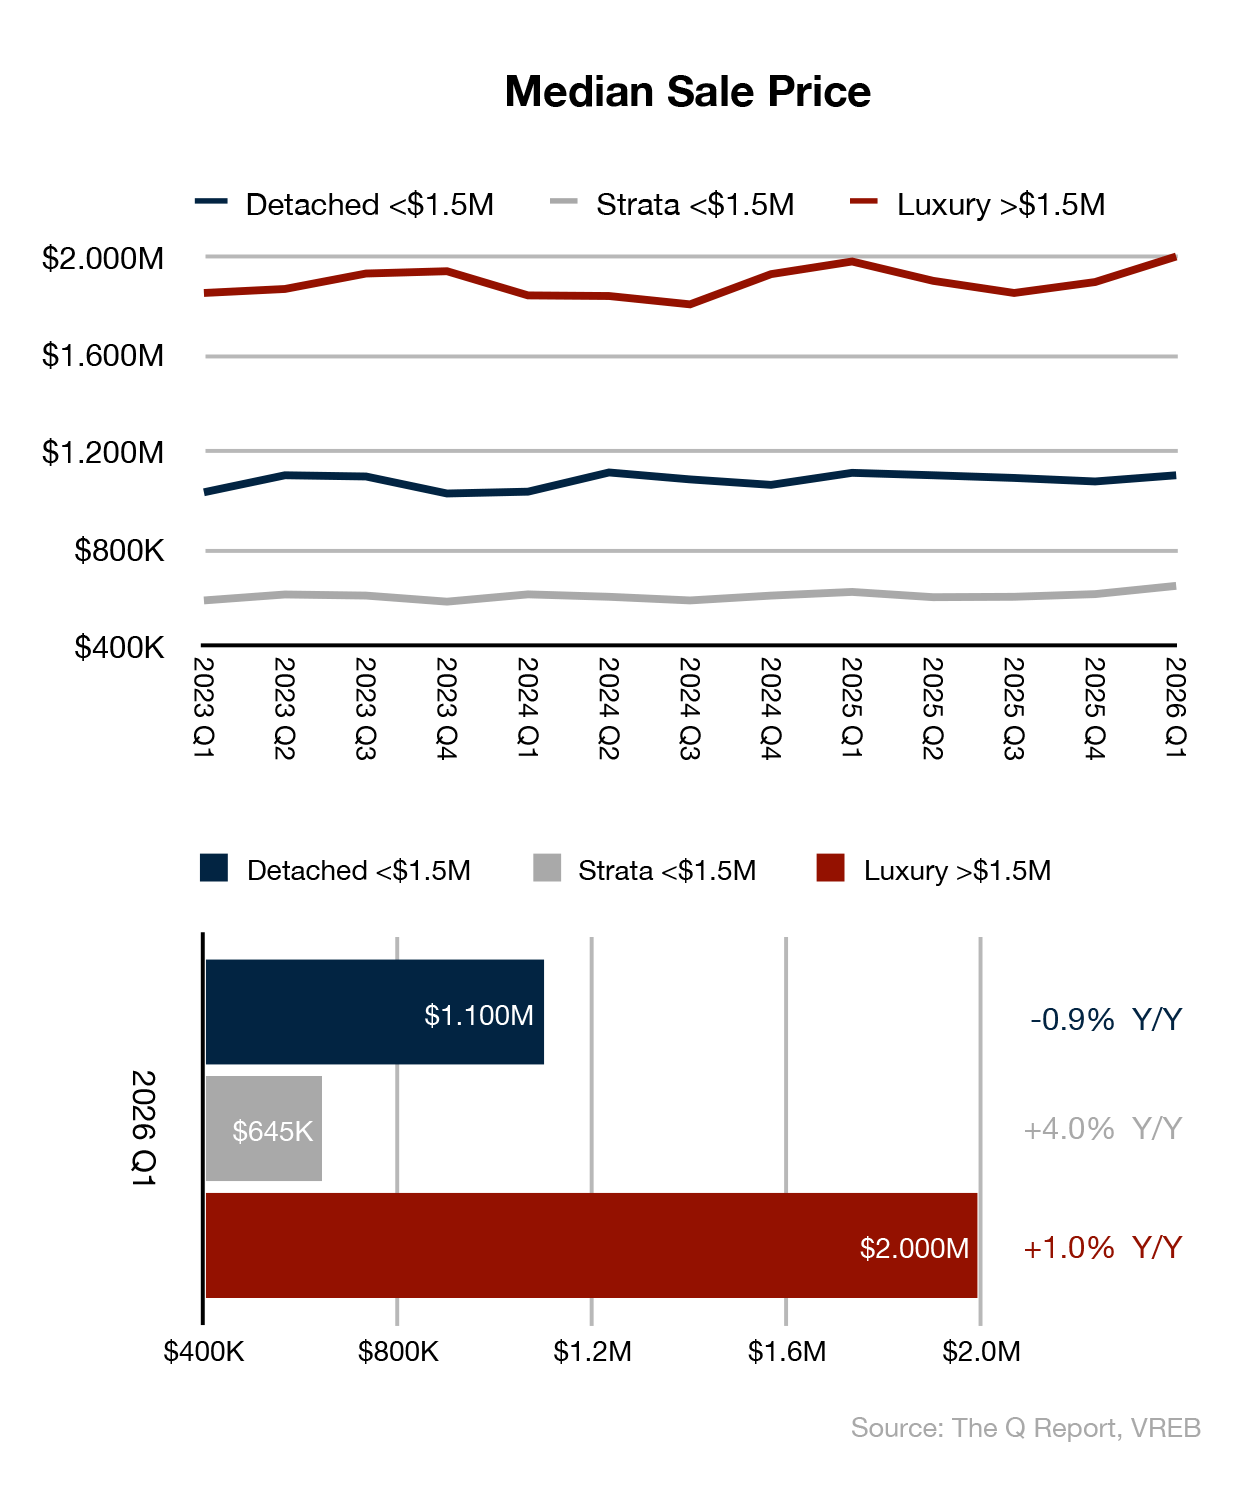
- Prices Hold or Improve: Despite softer sales volumes, median prices were stable to positive across all segments. Detached held at $1,100,000 (-0.9% Y/Y), Strata posted a notable gain to $645,000 (+4.0% Y/Y), and Luxury reached a milestone $2,000,000 median (+1.0% Y/Y).
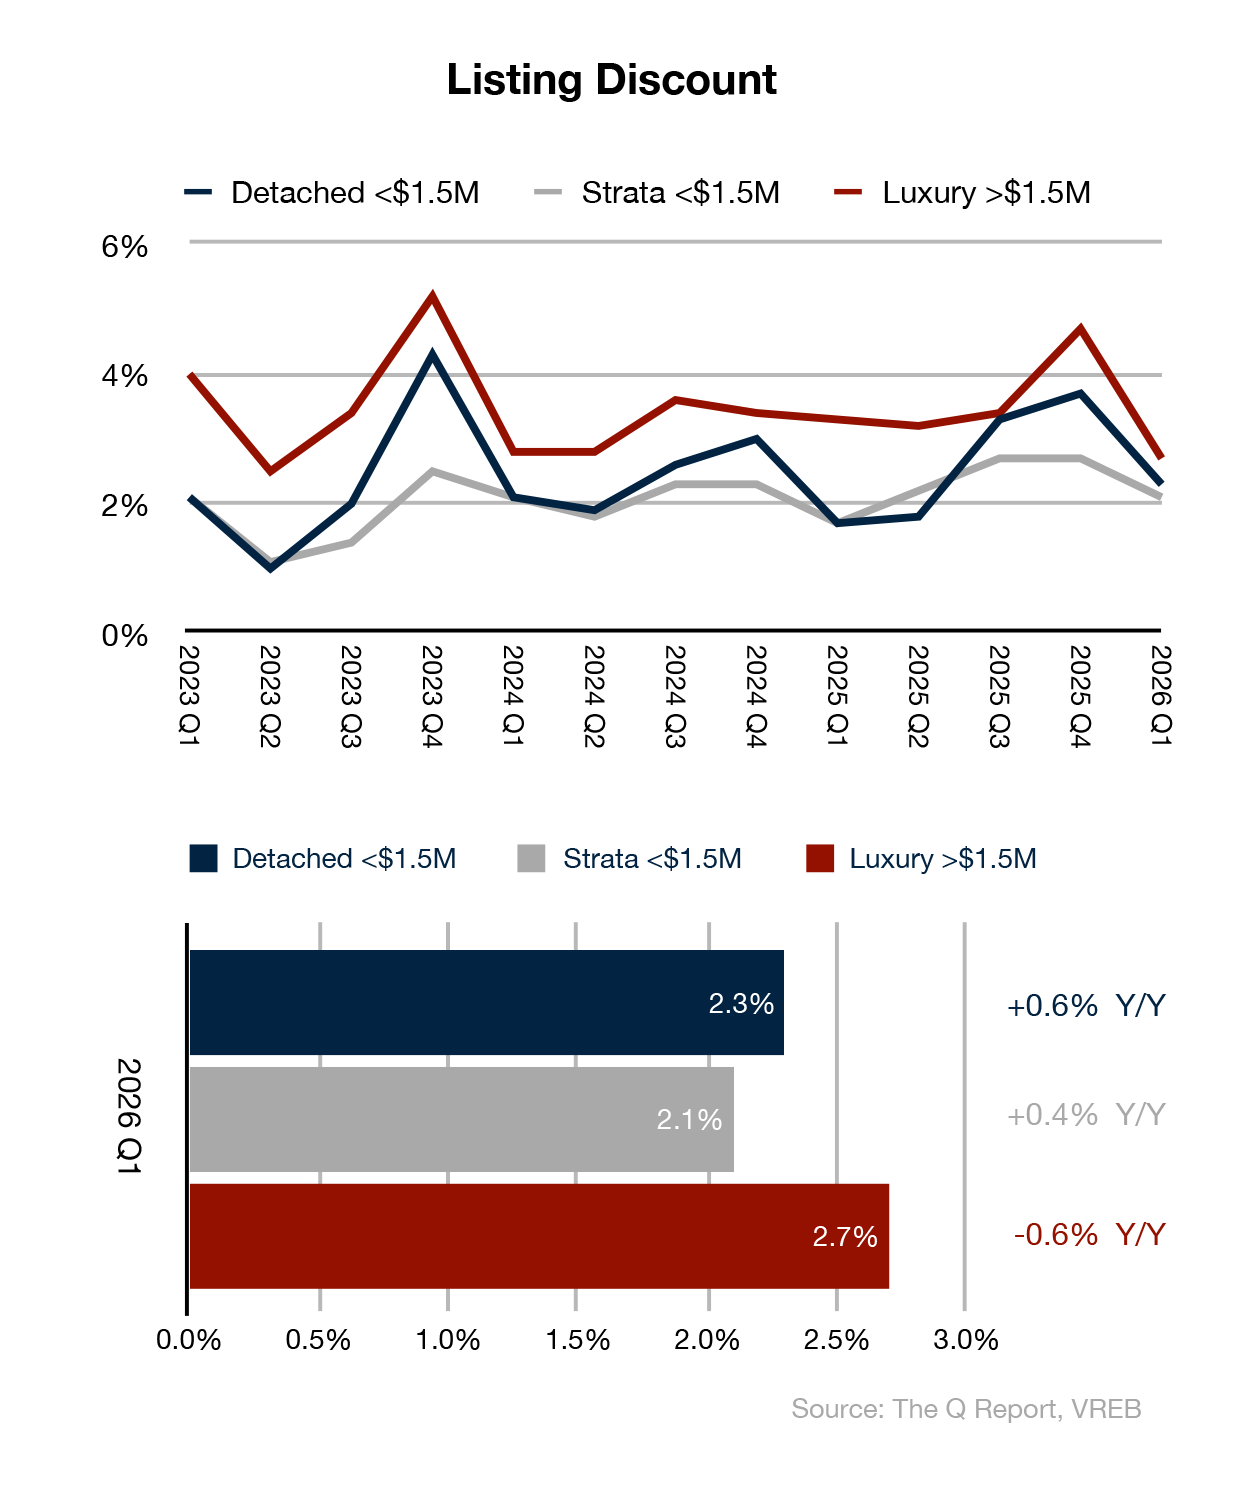
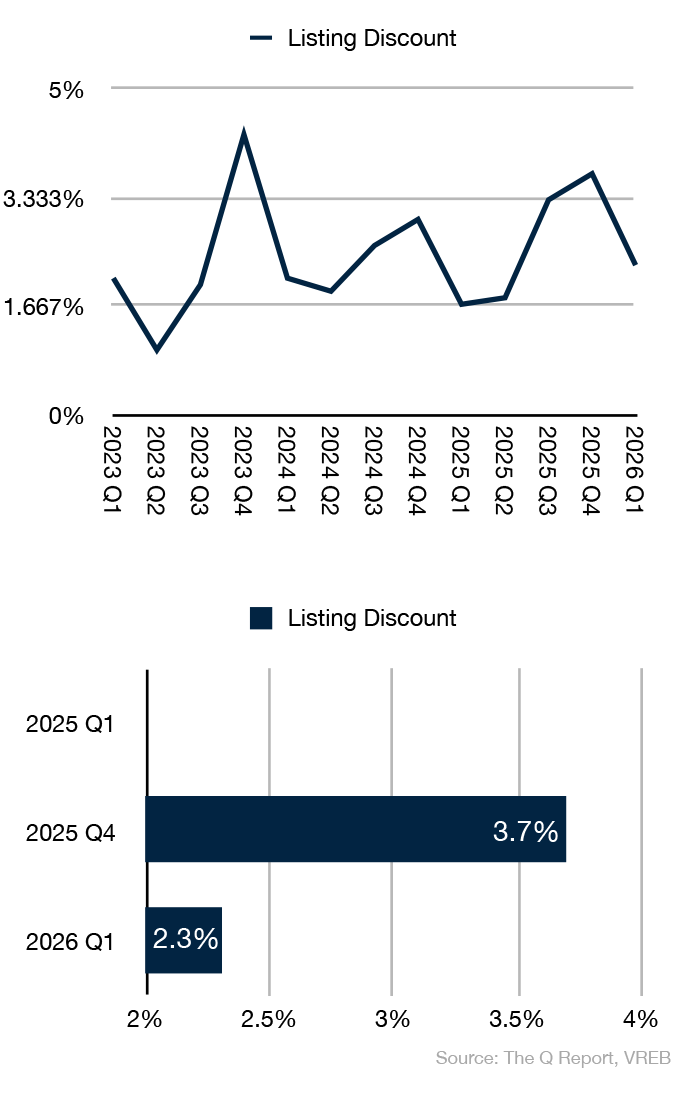
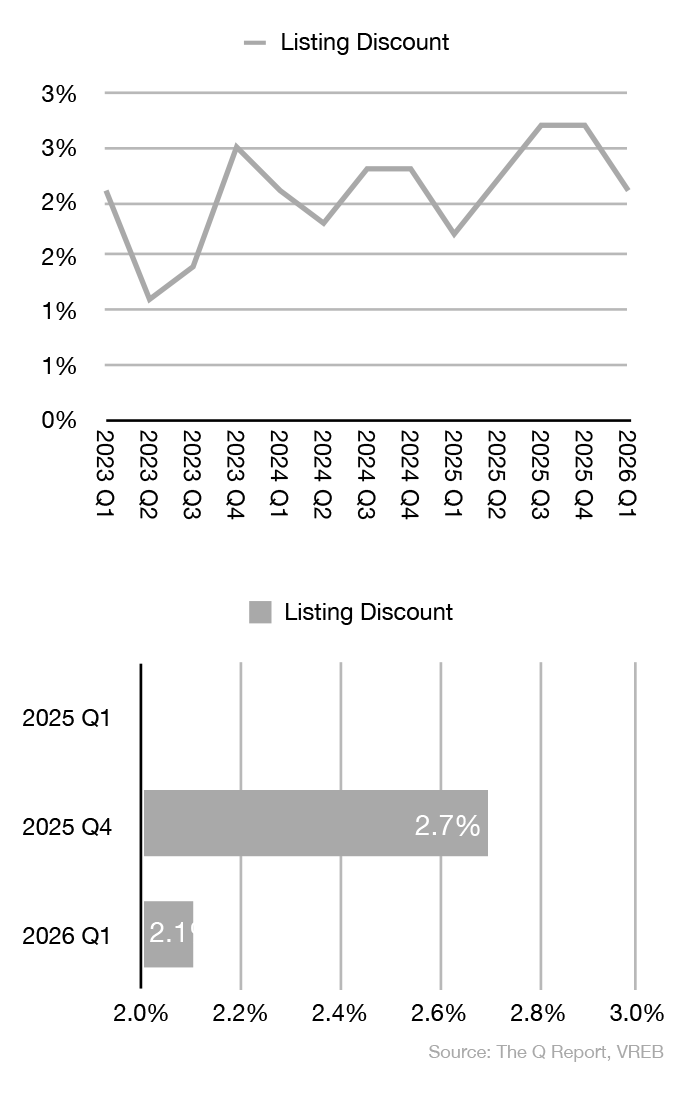
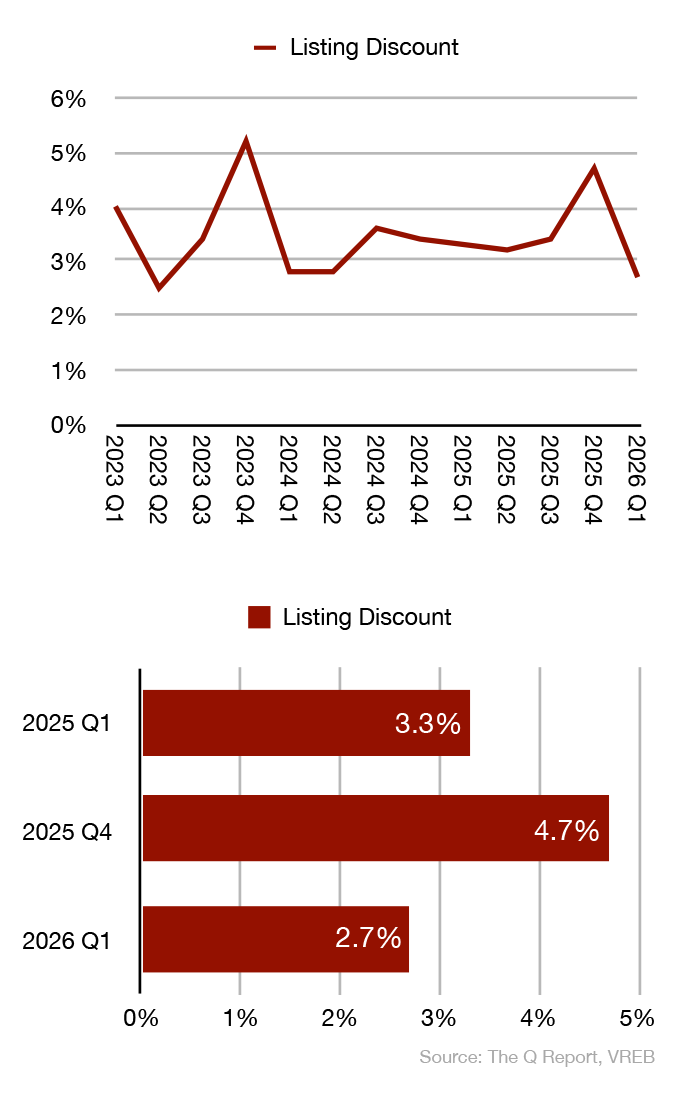
- Listing Discounts Tighten: One of the most encouraging signals of the quarter was the meaningful improvement in listing discounts across all segments relative to Q4 2025. Detached discounts narrowed from 3.7% to 2.3%, Strata from 2.7% to 2.1%, and Luxury from 4.7% to 2.7% — reflecting more accurate pricing as the spring market approaches.
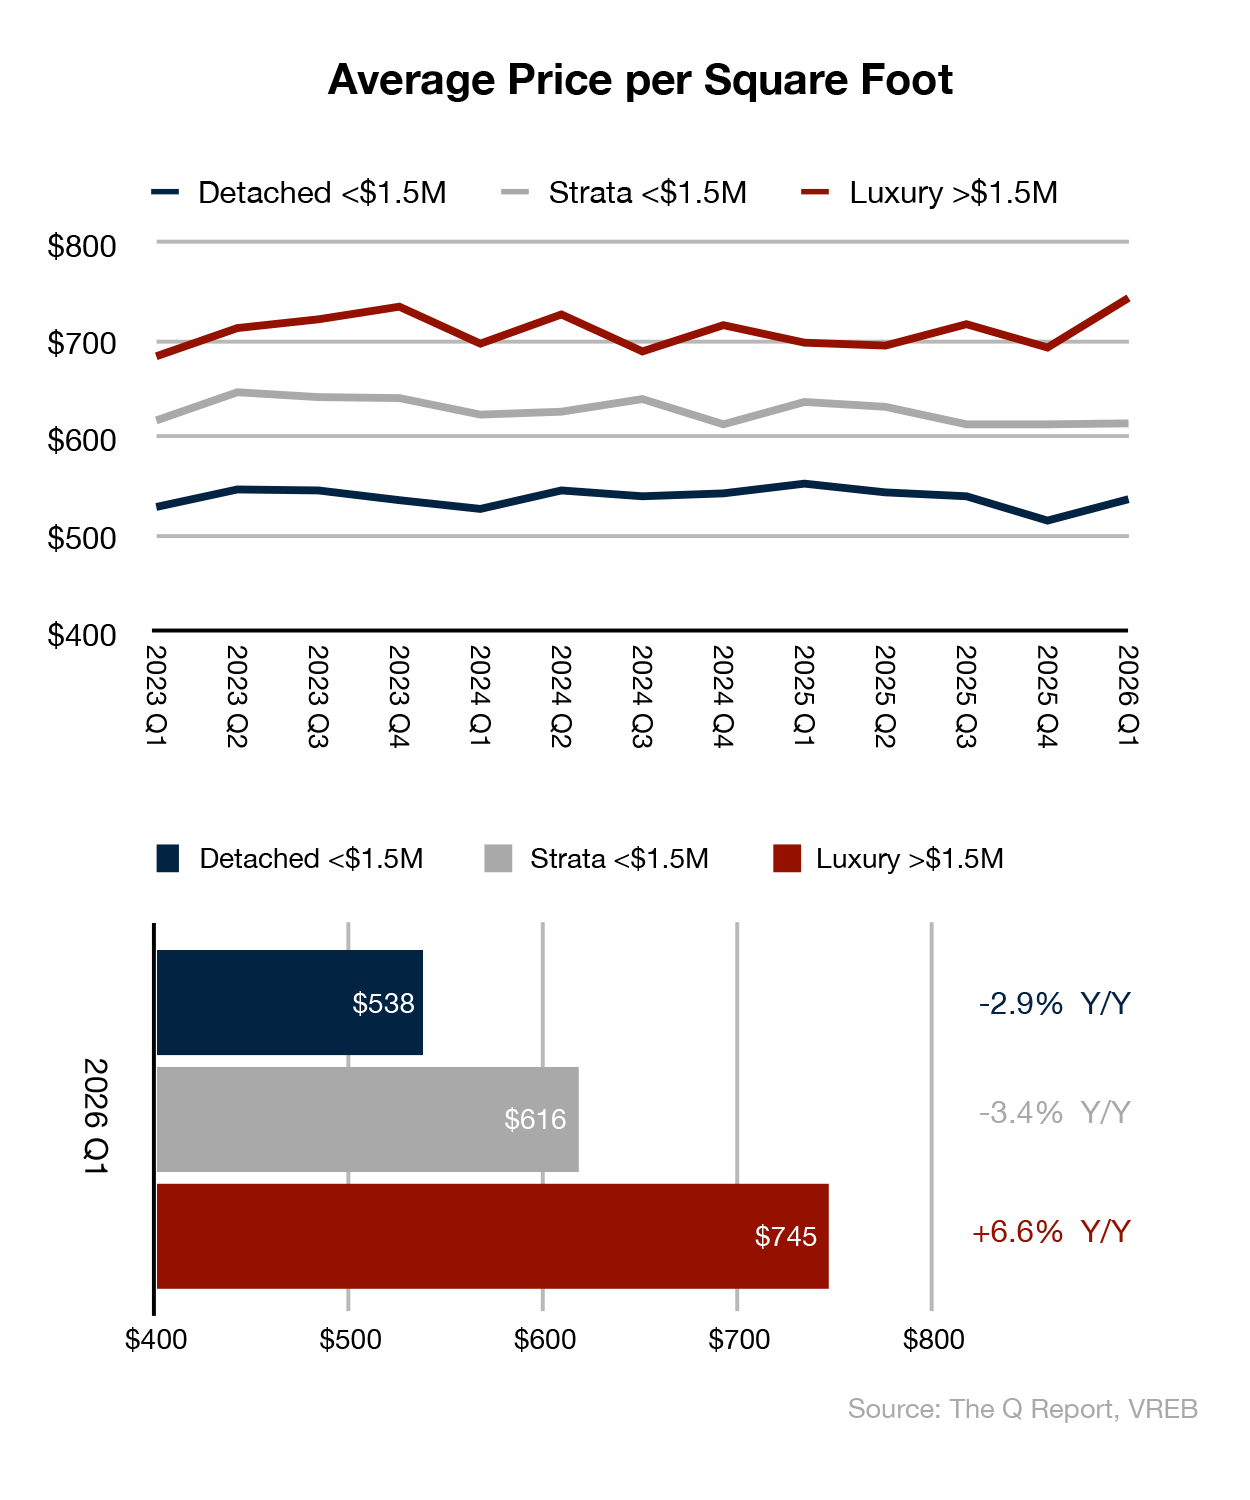
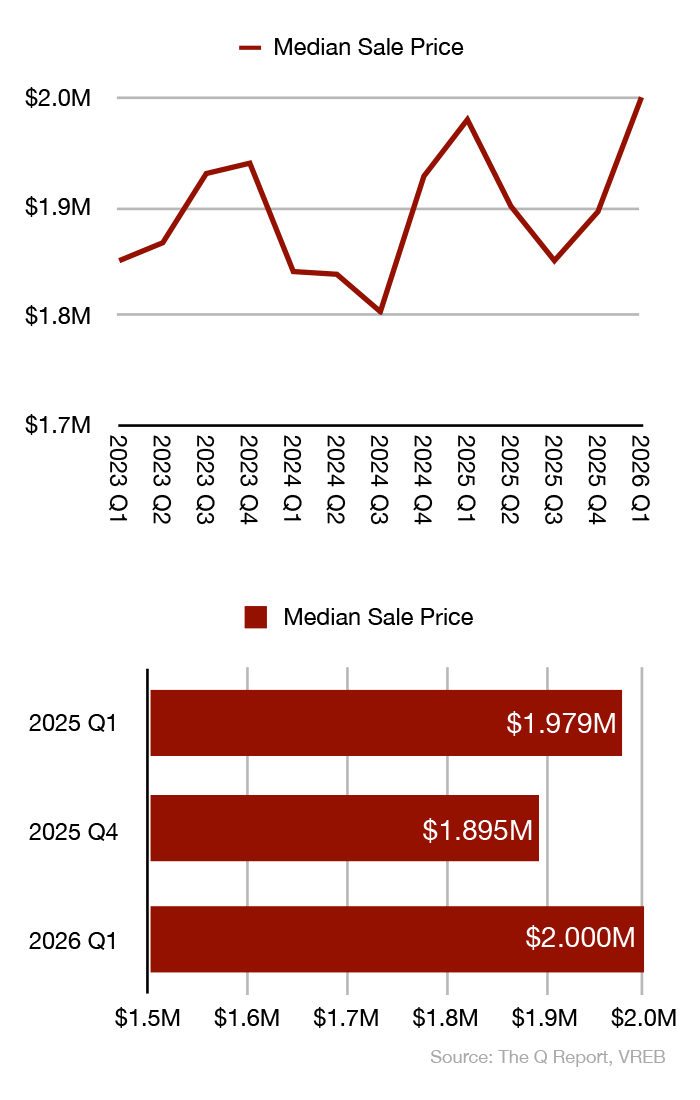
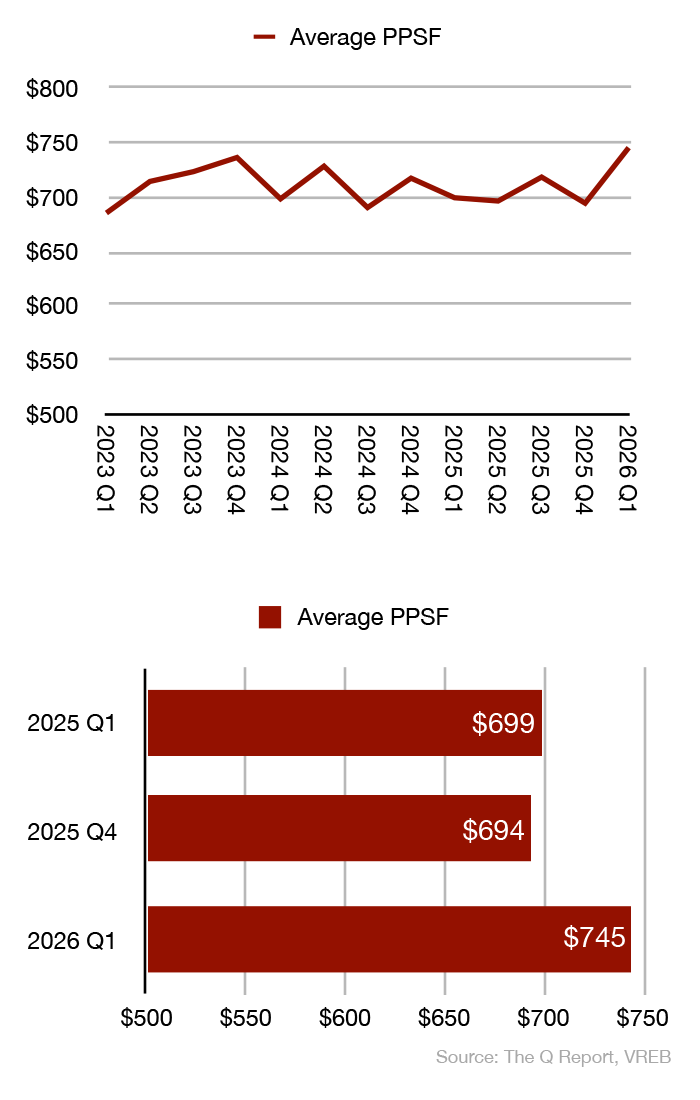
- Luxury Leads the Way: The Luxury segment (>$1.5M) was the standout performer, with sales up +3.9% year-over-year, price per square foot surging +6.6% Y/Y to $745, and the median sale price crossing the $2M threshold for the first time in recent quarters.
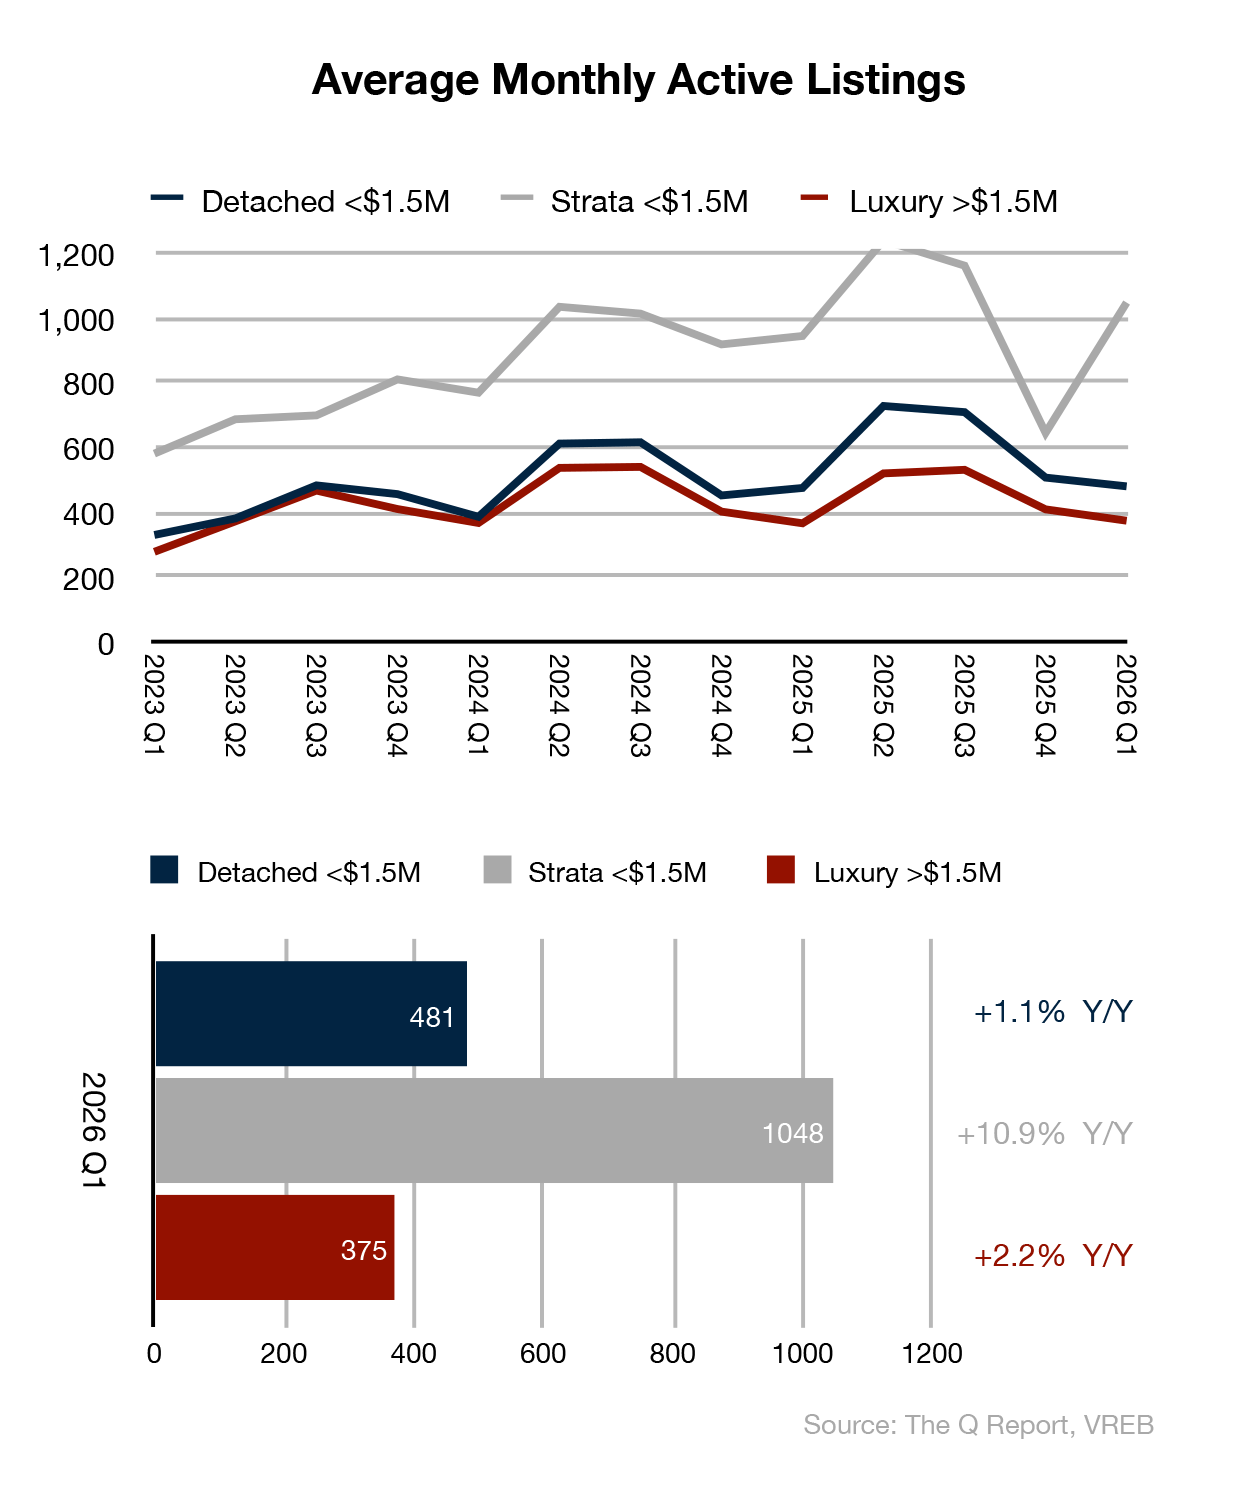
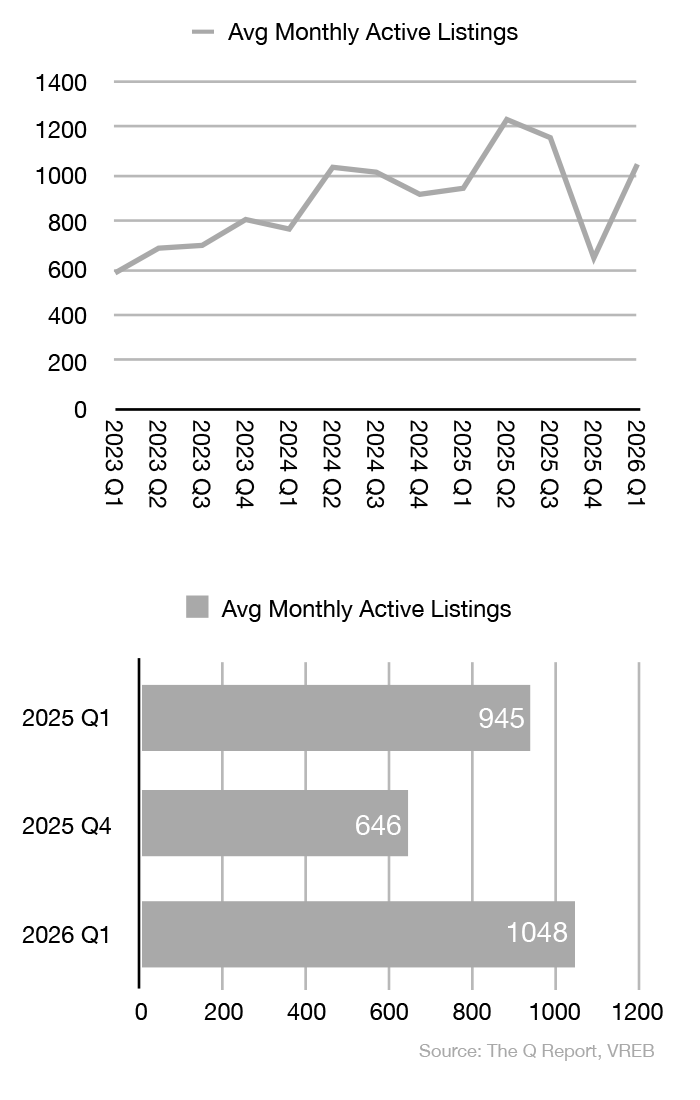
- Inventory Builds in Strata: Average monthly active listings in the Strata segment surged +62.2% quarter-over-quarter to 1,048 — the spring listing wave arriving in force. Year-over-year, Strata inventory is up +10.9%, which warrants monitoring as the season progresses.
THE BIG PICTURE: Spring Stirs, Caution Lingers
Q1 2026 is best understood through two lenses: the seasonal reset that always occurs as the market transitions from a quiet Q4 into the spring selling season, and the broader economic environment that is shaping buyer and seller psychology. On both fronts, the story is nuanced.
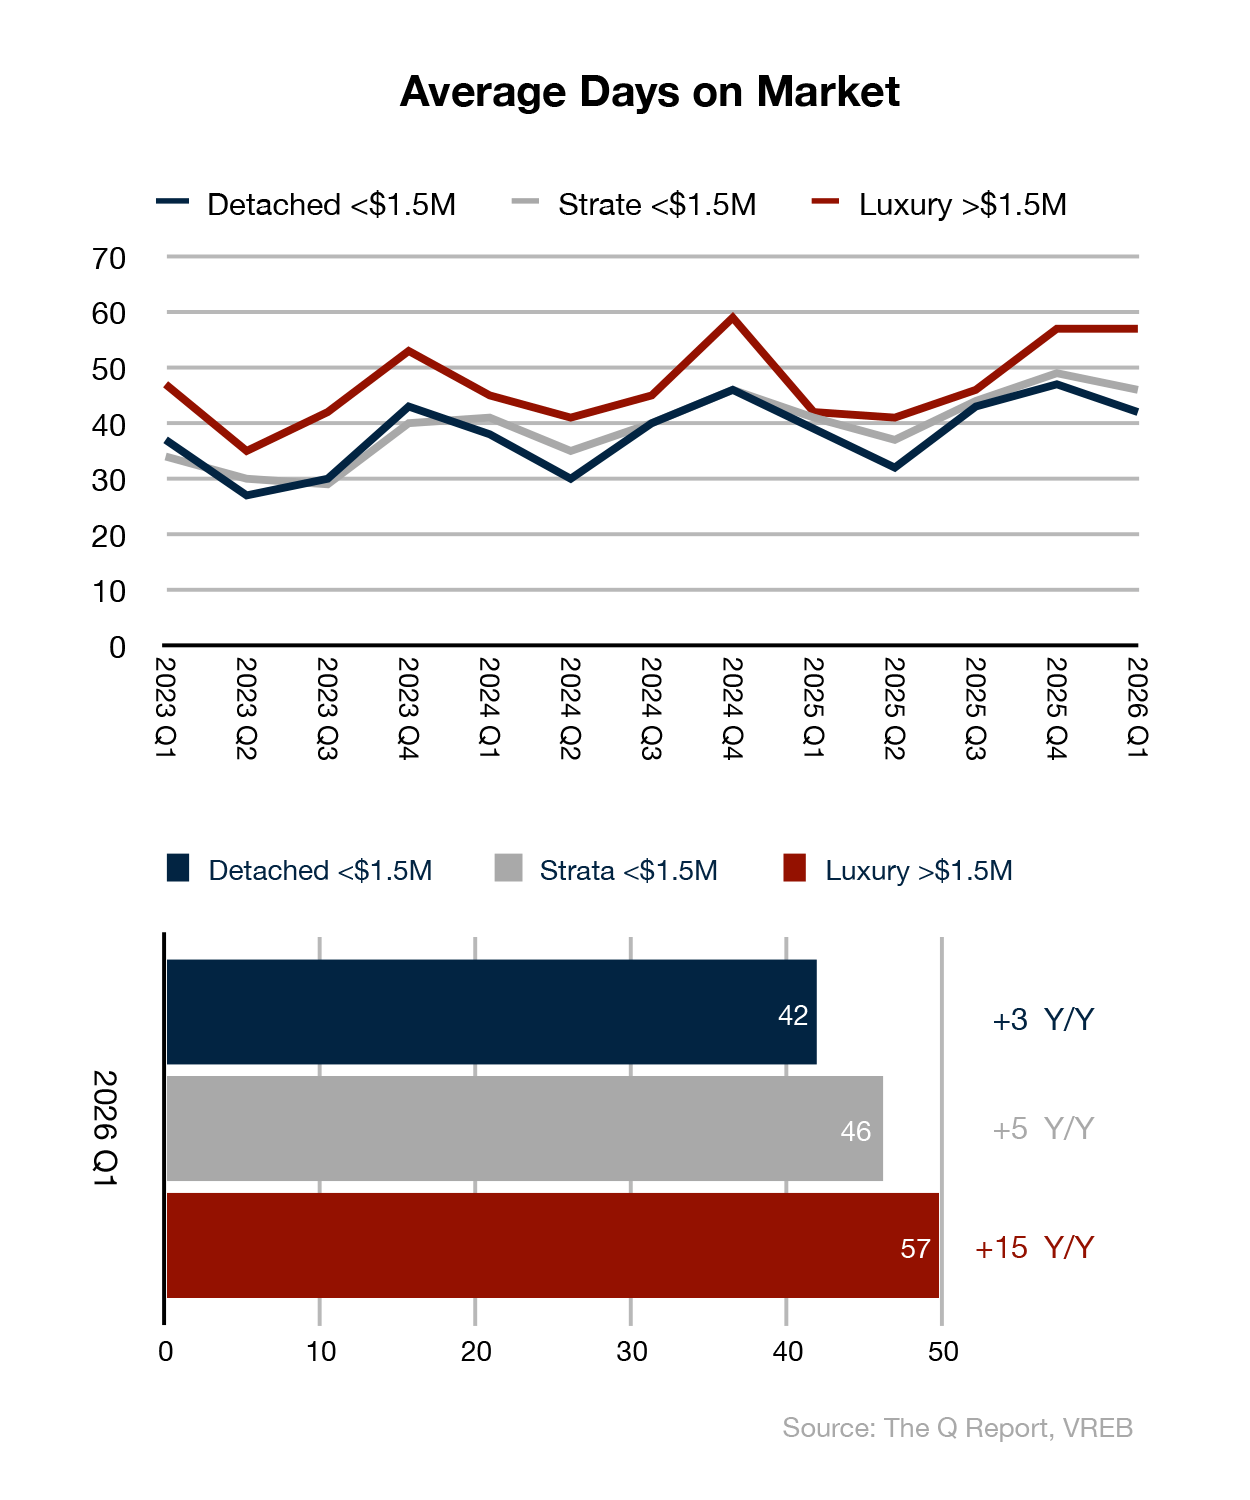
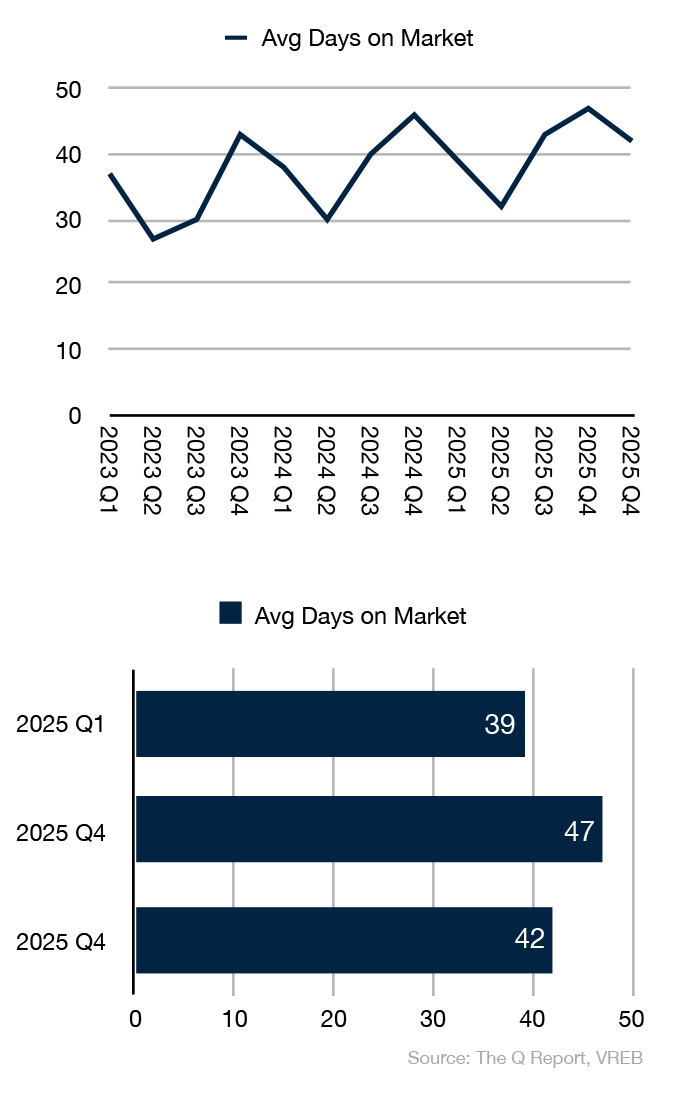
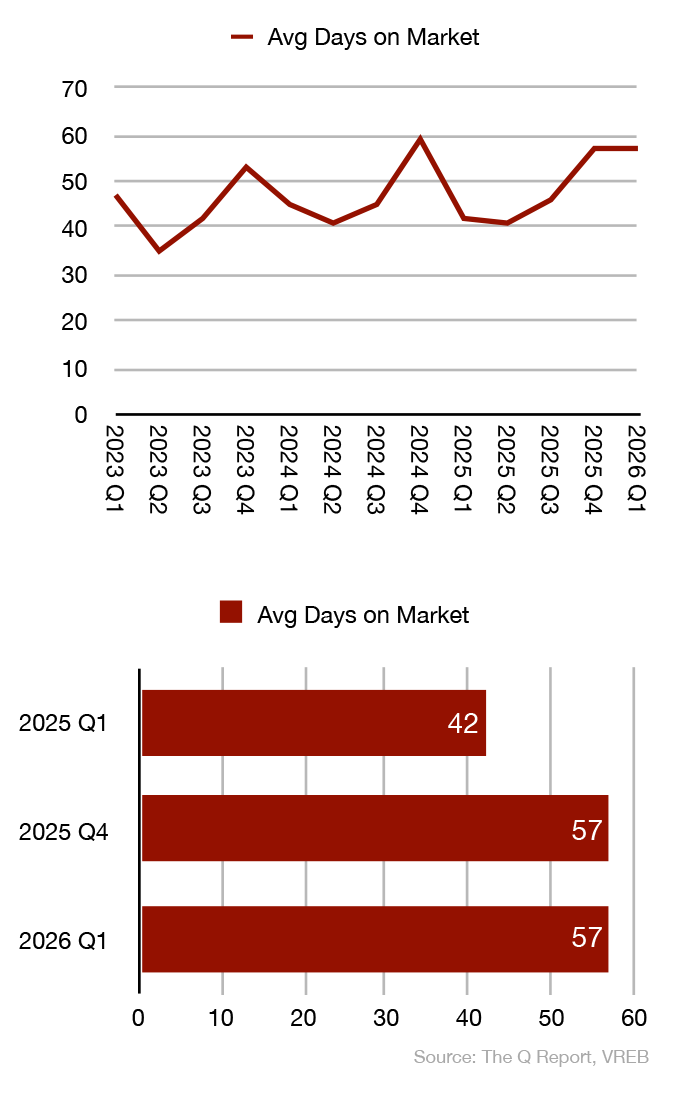
- Days on Market Improving: Average days on market fell across all segments relative to Q4 2025. Detached properties averaged 42 days (down 5 from Q4), Strata averaged 46 days (down 3 from Q4), and Luxury held steady at 57 days. Year-over-year, all segments are slower than Q1 2025 — Detached by 3 days, Strata by 5, and Luxury by a notable 15 days — reflecting the ongoing market adjustment to balanced conditions.
- Pricing Accuracy is Rewarded: The tightening of listing discounts from Q4 to Q1 across all segments is an important signal to note. Sellers who entered 2026 with realistic pricing expectations found a more receptive market. The data confirms that overpriced listings remain the primary driver of extended days on market, while well-priced properties are transacting within reasonable timeframes.
- Inventory to Watch: The Strata segment’s sharp Q/Q inventory jump to 1,048 active listings is the headline inventory story of the quarter. While this is a predictable seasonal pattern, the year-over-year increase of +10.9% suggests that supply continues to build. Whether demand absorbs this inventory through the spring will be one of the key indicators for the balance of 2026.
Detached Homes, <$1.5M
The Detached Market: Stable Pricing, Seasonal Rhythm
The single-family detached market opened 2026 with a characteristically quiet Q1, but underlying price metrics tell a story of continued stability and, in some respects, modest improvement.
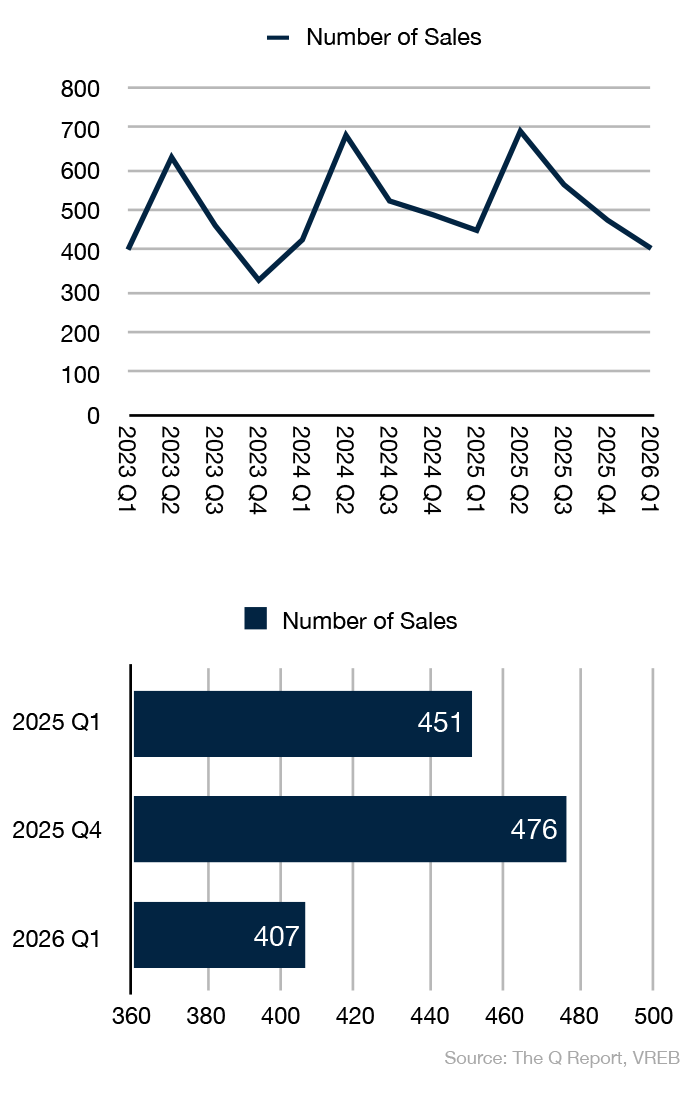
- Sales Activity: 407 detached homes (<$1.5M) sold in Q1 2026, down -14.5% from Q4 2025 and -9.8% year-over-year versus Q1 2025’s 451 sales. This level of activity reflects a typical Q1 seasonal pattern and is broadly consistent with the pace established through 2023-2024. The market is moving, just not at the pace of the pandemic-era peak.
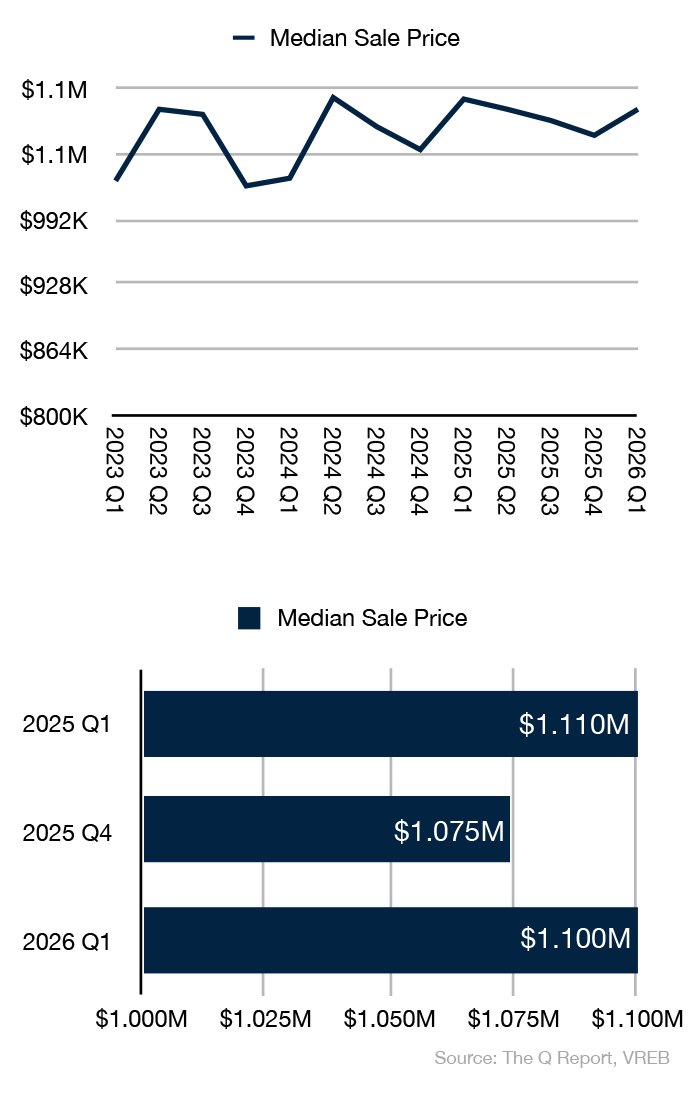
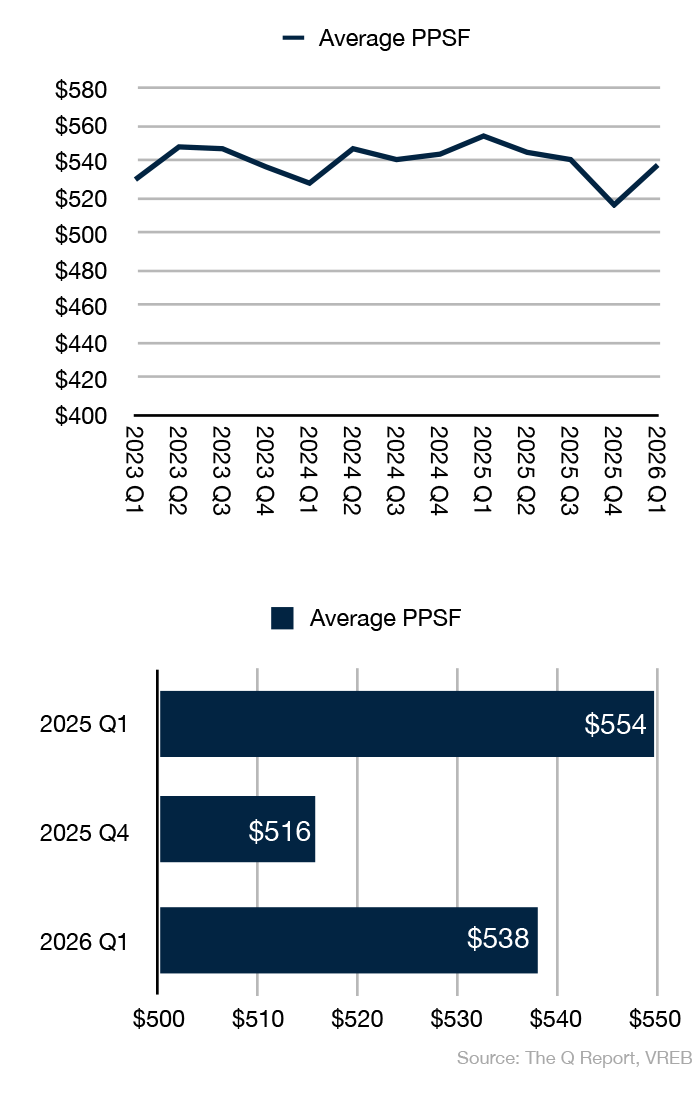
- Price Performance: The median sale price returned to $1,100,000, up +2.4% from Q4 2025’s $1,074,500 and effectively flat (-0.9%) compared to Q1 2025’s $1,110,000. The price per square foot of $538 represents a +4.3% quarter-over-quarter recovery from Q4’s $516, though it remains -2.9% below Q1 2025’s $554. Overall, this is a segment that is holding value steadily over time, with minor fluctuations due to the mix of properties sold.
- Listing Discount Improvement: The listing discount tightened significantly to 2.3%, down from 3.7% in Q4 2025, and only modestly above Q1 2025’s 1.7%. This is a meaningful signal — sellers entering the spring market are pricing more accurately, and the gap between original asking price and final sale price is narrowing.
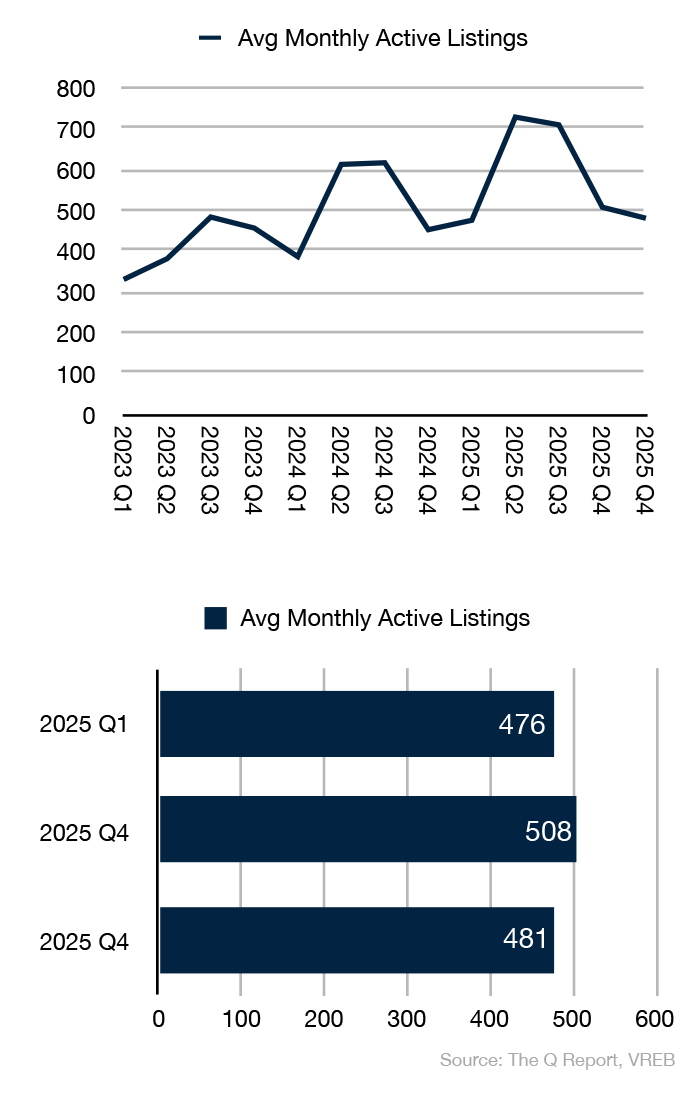
- Inventory Dynamics: Average monthly active listings of 481 were down -5.3% from Q4 2025’s 508 but +1.1% above Q1 2025’s 476. Inventory remains well within balanced market parameters, providing meaningful selection for buyers without overwhelming supply putting significant downward pressure on prices.
Strata Homes, <$1.5M
The Strata Market: Prices Climb, Inventory Surges
The strata segment delivered a tale of two metrics in Q1 2026: year-over-year price gains that stand out across the market overview, paired with a significant surge in active listings as the spring selling season arrived early and emphatically.
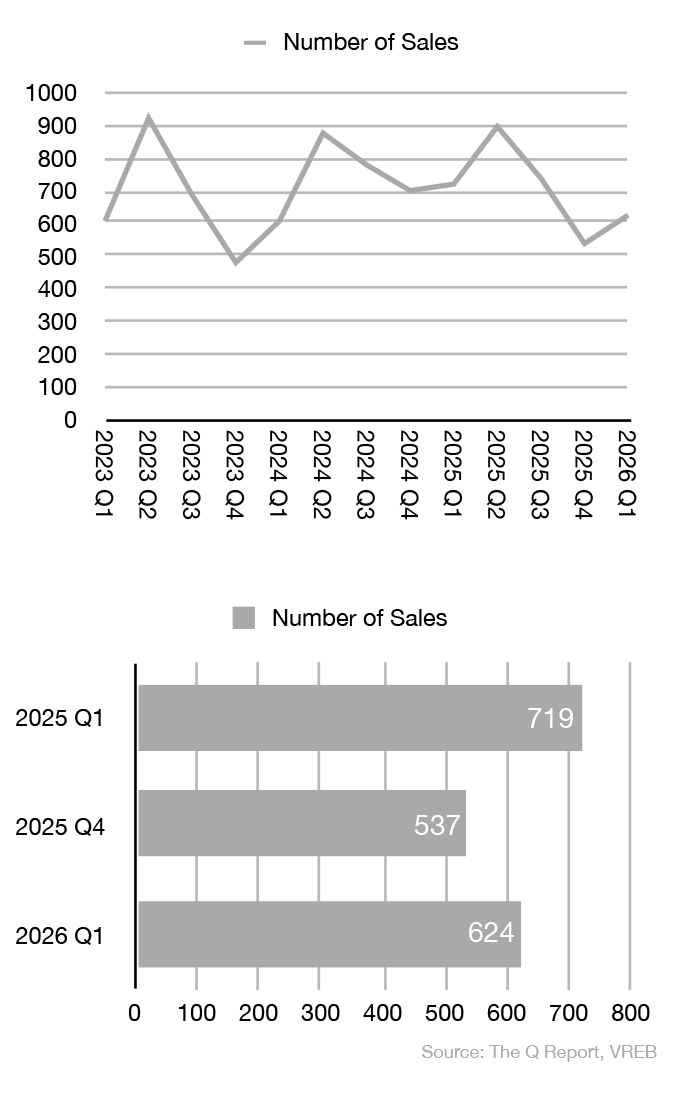
- Sales Volume: 624 strata sales in Q1 2026 represented a +16.2% bounce from Q4 2025’s 537 — a healthy seasonal rebound — but remained -13.2% below Q1 2025’s 719 sales. The year-over-year decline reflects ongoing affordability pressures and rate sensitivity at the entry level, though the quarterly improvement suggests buyer activity is picking up as the spring market approaches.
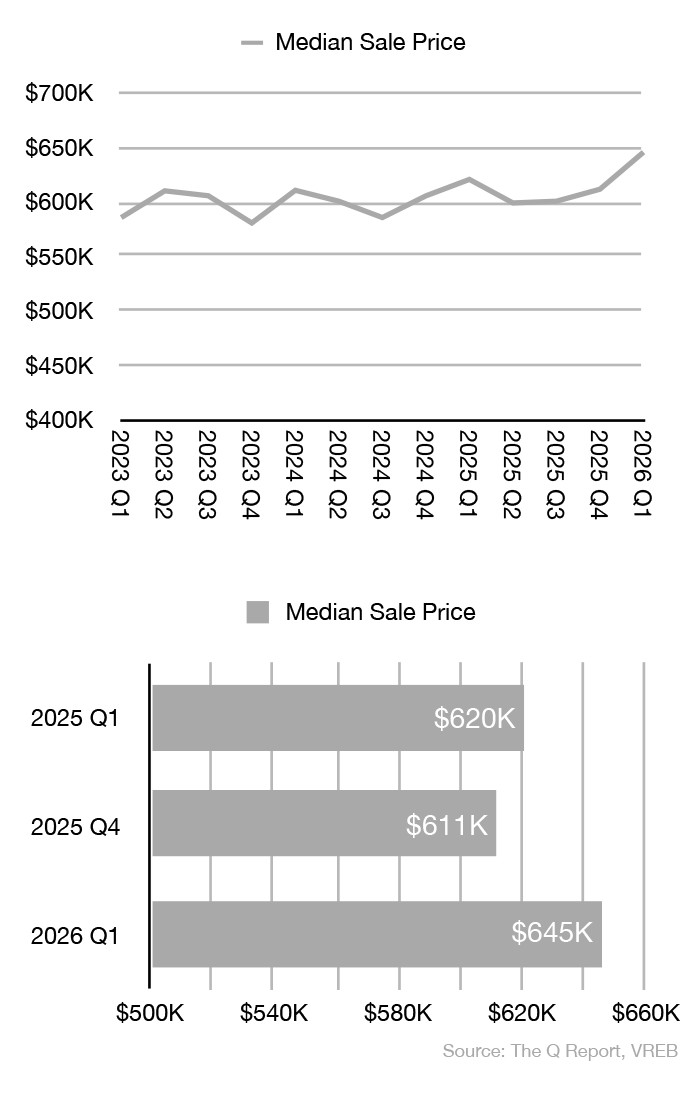
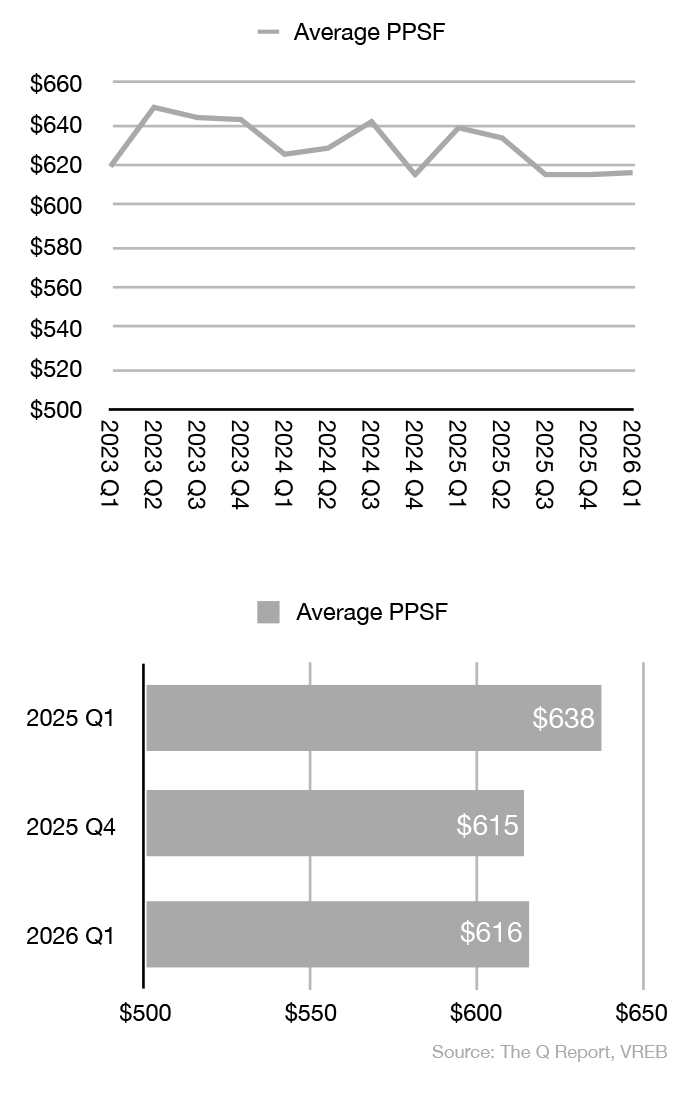
- Price Performance: The median sale price of $645,000 was the standout price figure of the quarter — up +5.6% from Q4 2025’s $611,000 and +4.0% above Q1 2025’s $620,000. This is the strongest year-over-year median price performance of any segment this quarter. Price per square foot of $616 is essentially flat relative to Q4 2025 ($615) and -3.4% below Q1 2025 ($638), suggesting that buyers are moving into larger or higher-quality strata units rather than a broad-based price escalation.
- Inventory Surge: Average monthly active listings jumped to 1,048 — up a striking +62.2% from Q4 2025’s 646 and +10.9% above Q1 2025’s 945. This is the spring listing wave, and it is significant. Whether demand can absorb this inventory through Q2 will be an important indicator for strata price stability through the balance of 2026. Sellers who priced accurately in Q4 found buyers; those who didn’t will be competing with an increasingly well-stocked field in Q2.
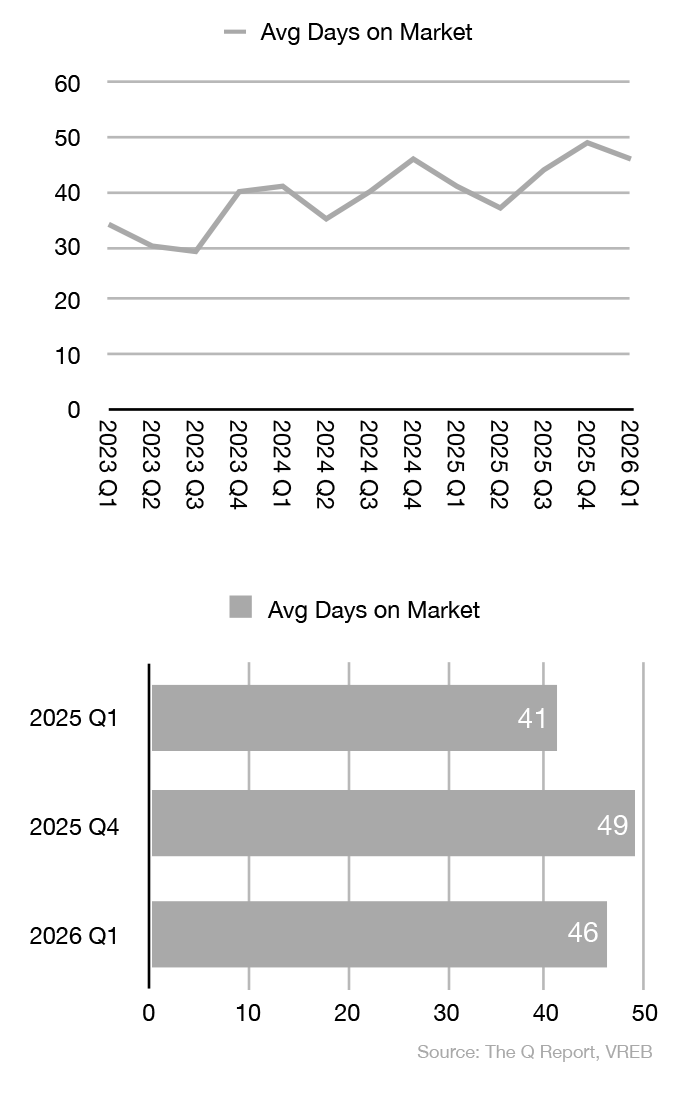
- Days on Market and Discount: Strata properties averaged 46 days on market in Q1 2026, down 3 days from Q4 and 5 days above Q1 2025. The listing discount tightened to 2.1% from 2.7% in Q4 — a positive signal for appropriately priced inventory entering the spring market.
Luxury Homes, >$1.5M

The Luxury Market (>$1.5M): A Milestone Quarter
The luxury segment had perhaps the most noteworthy story of Q1 2026, with the median sale price crossing the $2,000,000 threshold and price per square foot posting its strongest year-over-year performance in recent memory. Patient, discerning buyers continue to transact — on their timeline, and at proper prices.
- Sales Volume: 158 luxury properties sold in Q1 2026, down modestly -3.7% from Q4 2025’s 164 but up +3.9% year-over-year from Q1 2025’s 152 sales. This counter-cyclical performance relative to the other segments underscores that affluent buyers are less rate-sensitive and are selectively taking advantage of improved selection and realistic seller pricing.
- Price Milestone: The median sale price reached $2,000,000 — up +5.5% from Q4 2025’s $1,895,000 and +1.0% above Q1 2025’s $1,979,500. More telling is the price per square foot of $745, up +7.3% from Q4 and a strong +6.6% year-over-year. This suggests that quality luxury product is attracting well-informed buyers willing to pay for it.
- Listing Discount Narrows Sharply: The luxury listing discount tightened dramatically to 2.7% from Q4 2025’s 4.7% — the largest quarter-over-quarter improvement of any segment. This 2.0-point swing signals that sellers entering Q1 priced their properties significantly more accurately than in Q4, or that buyers were more willing to pay closer to asking. Either way, it reflects a more efficient luxury market.
- Extended Timelines Persist: Luxury properties averaged 57 days on market — flat from Q4 2025 and up 15 days from Q1 2025’s 42 days. The year-over-year increase is the largest of any segment and serves as a reminder that the luxury market rewards patience. Properties that combine exceptional value with accurate pricing move efficiently; everything else waits.
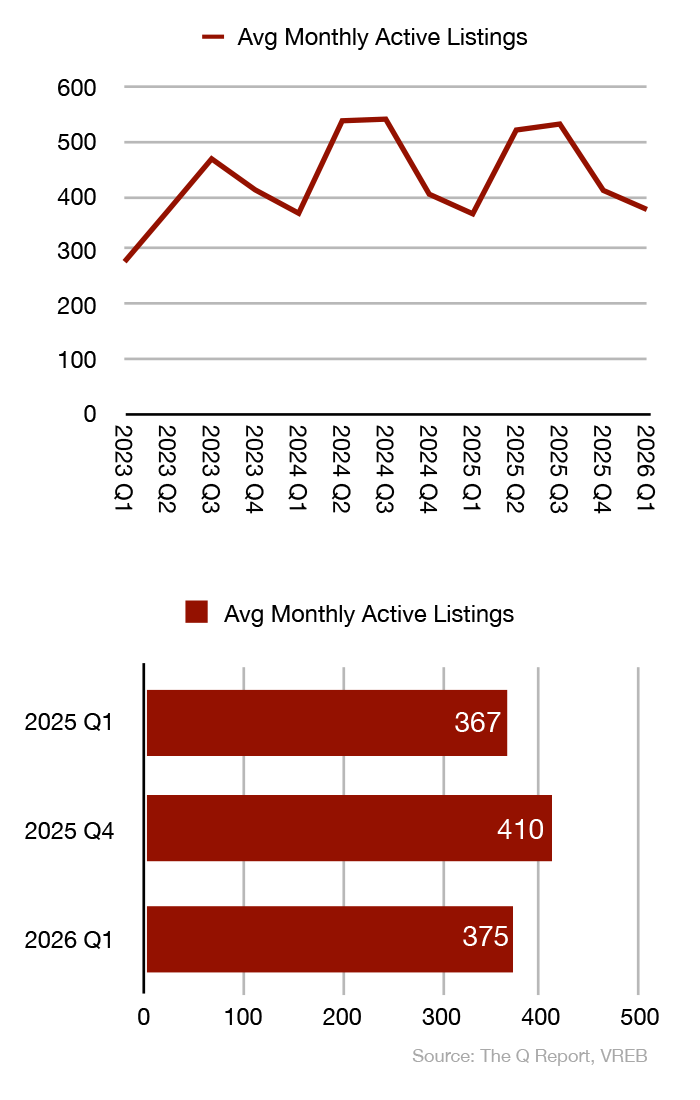
- Inventory Eases: Average monthly active listings of 375 fell -8.5% from Q4 2025’s 410 and are only +2.2% above Q1 2025’s 367 — the tightest inventory condition of any segment. Constrained luxury supply combined with strong PPSF growth supports the narrative of a resilient upper market.
HPI® TRENDS
The MLS® Home Price Index® (MLS® HPI®) is purpose-built to gauge neighbourhoods’ home price levels and trends, using more than a decade of sales data and sophisticated statistical models to define a “typical” home based on the value home buyers assign to various attributes on homes that have been bought and sold. These benchmark homes are tracked across localized neighbourhoods and different types of houses. The Q Report’s HPI® trends compares relative regional price movements around Greater Victoria by tracking the HPI® Composite Benchmark Price across 15 districts, comparing Y/Y price changes.
HPI ANALYSIS: Modest Softening, Pockets of Resilience
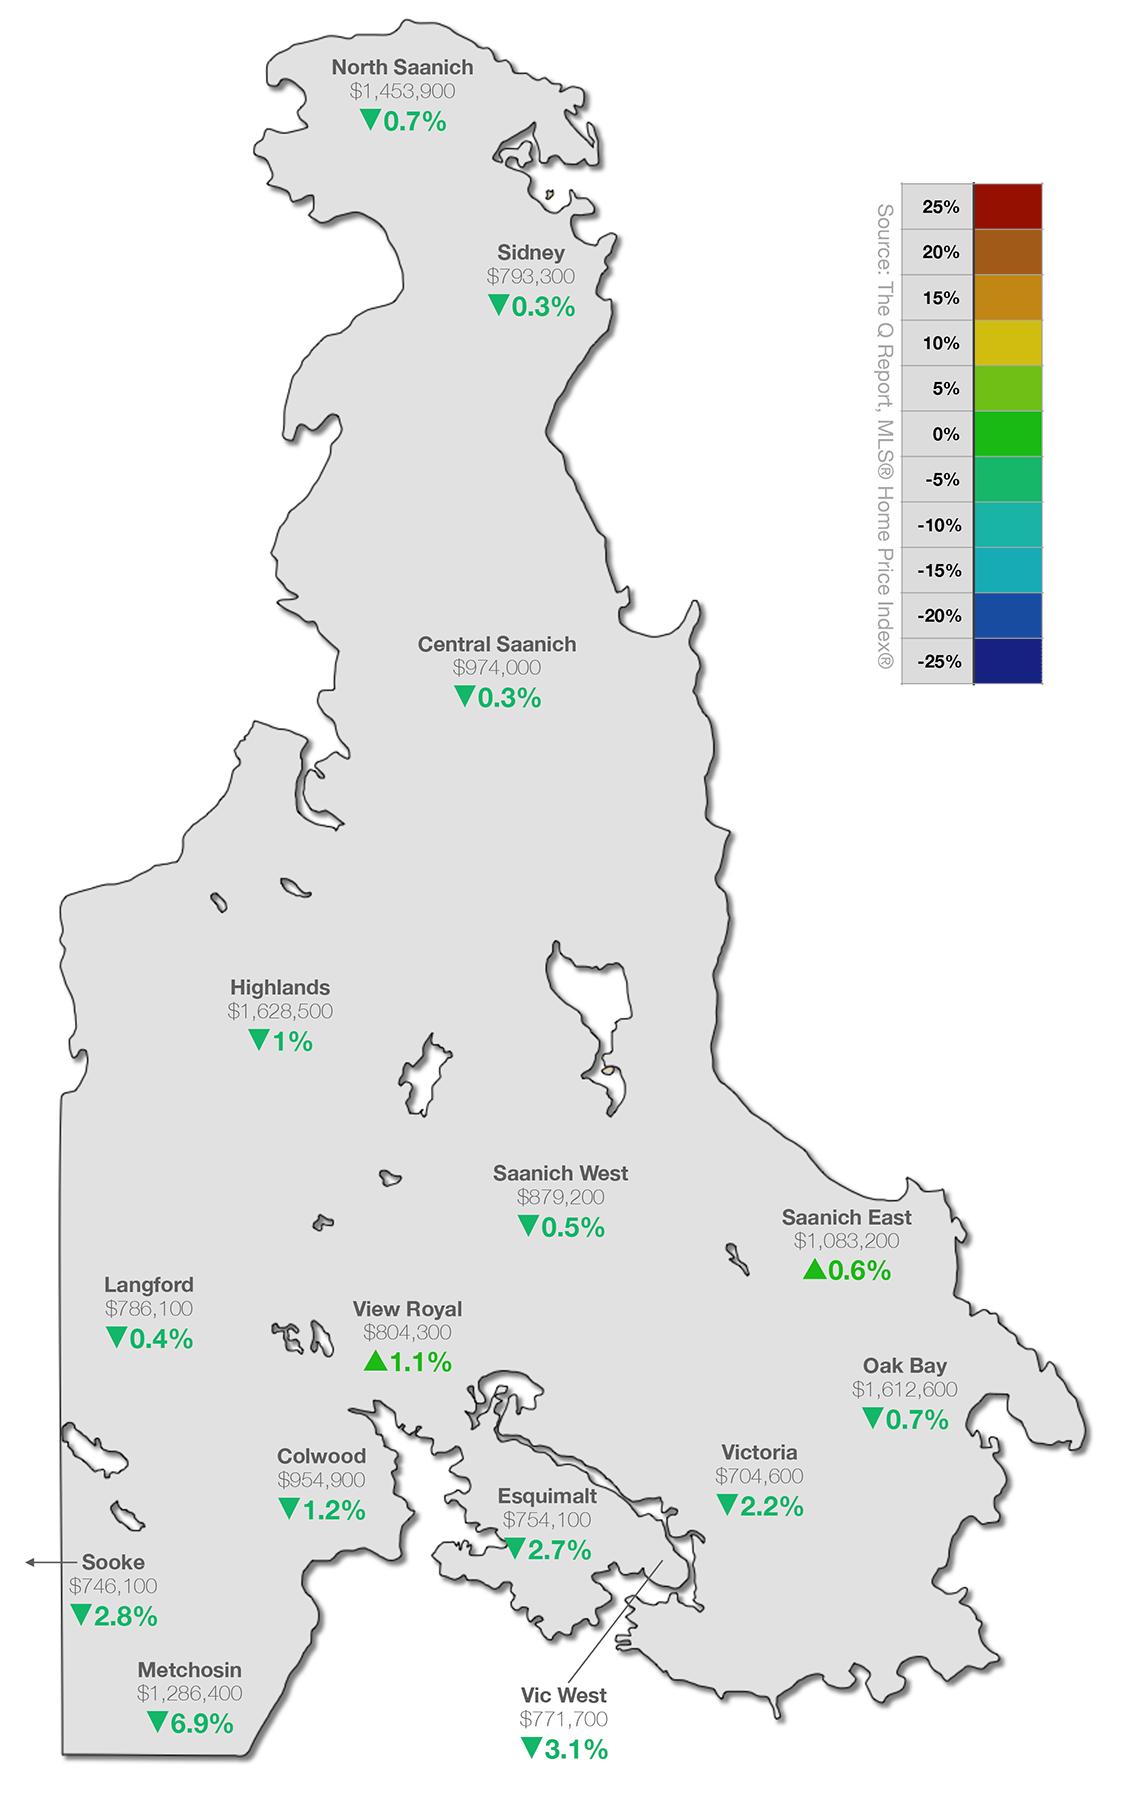
The MLS® Home Price Index map for Q1 2026 reveals a market where modest year-over-year declines are the norm across most districts, with two notable exceptions bucking the trend. The broad pattern reflects the balanced market conditions that have defined Greater Victoria over the past several quarters — not a sharp correction, but a measured normalization from pandemic-era highs.
- Bright Spots: View Royal leads all districts with a +1.1% year-over-year HPI gain to a benchmark of $804,300, followed by Saanich East at +0.6% to $1,083,200. These areas continue to attract buyers seeking relative value within commuting distance of the urban core, and their performance suggests that demand for well-located, family-oriented communities remains solid.
- Most Significant Softening: Metchosin saw the steepest decline at -6.9% to $1,286,400 — though the low transaction volume in this semi-rural district can produce outsized swings from a small number of sales. Vic West (-3.1% to $771,700), Sooke (-2.8% to $746,100), Esquimalt (-2.7% to $754,100), and Victoria proper (-2.2% to $704,600) all saw more meaningful year-over-year declines, reflecting continued price sensitivity in denser, urban areas, particularly where condos make up a larger share of the composite index.
- The Stable Middle: The majority of Peninsula and Westshore communities posted modest declines of -0.3% to -1.2%, including Central Saanich (-0.3% to $974,000), Sidney (-0.3% to $793,300), Saanich West (-0.5% to $879,200), North Saanich (-0.7% to $1,453,900), Oak Bay (-0.7% to $1,612,600), Colwood (-1.2% to $954,900), and Highlands (-1.0% to $1,628,500). These sorts of modest adjustments reflect a market finding equilibrium, not one in retreat.
FORWARD VIEW: Q2 2026
Spring 2026 is now officially underway, and the data from Q1 sets up an interesting next chapter for the Victoria market. The combination of tightening listing discounts, a recovering strata median price, and a landmark luxury quarter offers genuine reasons for cautious optimism — but the strata inventory surge and persistent year-over-year sales softness are counterweights worth taking seriously.
The broader economic backdrop adds complexity. Global trade uncertainty — including ongoing Canada-U.S. tariff tensions — has introduced a layer of hesitation for some buyers, particularly in the move-up and investment segments. And as the news cycle continues to focus on the Middle East, many consumers find reason to delay major financial decisions. Victoria’s market has historically demonstrated resilience in the face of external headwinds, but buyer confidence can be fragile, and the spring market will be the clearest test of where demand truly sits.
For sellers, the message from Q1 is clear: accurate, current-market pricing is the single most effective tool in your arsenal. The sharp improvement in listing discounts from Q4 to Q1 tells us that sellers who came to market with realistic expectations found results, while the continued year-over-year softness in sales volumes confirms that buyers are not chasing overpriced inventory. For buyers, the combination of elevated strata inventory, continued balanced conditions, and extended days on market means the leverage and time for due diligence that opened in 2025 remains available — for now.
If you are thinking about making a move this year, do you think being well-informed, and having customized data insights would help you make the right decisions along the way? Get in touch now, book a no-hassle, no-obligation meeting and get our market insights working for you. We are only a click or call away.
Do you or someone you know need real estate advice, personalized market insights, a home marketed and sold using the best tools and accurate data? We are available to be your personal resource. Get in touch.
Subscribe, follow us on your favourite social platform, and reach out any time.
Dirk VanderWal & Fergus Kyne
Newport Realty Ltd.
(250) 385-2033 | info@victoriaqreport.com
Notes
All views and opinions expressed in The Q Report are solely those of its authors, Dirk VanderWal and Fergus Kyne, and do not necessarily represent the views or opinions of Newport Realty Ltd. or the Victoria Real Estate Board. Not intended to solicit parties already under contract. E&OE.
Terms
For a list of terms and definitions used in The Q Report, click here.
Data Analysis
The Q Report’s analysis includes listing and sales data exclusively from the Victoria Real Estate Board’s Multiple Listing Service® (MLS®) ‘Core’, ‘Westshore’, and ‘Peninsula’ regions. Data is analyzed for unconditional pending and completed sales that occurred between 2026/01/01 and 2026/03/31 except where specifically noted otherwise.
Data Sources
Bank of Canada
BC Real Estate Association
Canadian Real Estate Association
Victoria Real Estate Board