

INTRODUCTION
Welcome, Q Report readers, to our analysis of the Victoria real estate market for the fourth quarter of 2025. As the year drew to a close, we saw a market in consolidation mode. Inventory levels normalized after their mid-year surge, sales activity moderated seasonally, and prices remained remarkably stable across most segments. The defining theme of the quarter was equilibrium: the market found its footing in balanced territory, offering both buyers and sellers balanced expectations heading into 2026.
Last quarter continued the trend of thoughtfully priced properties finding buyers efficiently, while overpriced listings experienced extended time on market. The frenetic pace of previous years is now firmly in the rearview mirror, replaced by a more measured approach to transactions that benefits informed participants on both sides.
MARKET BREAKDOWN
Overview
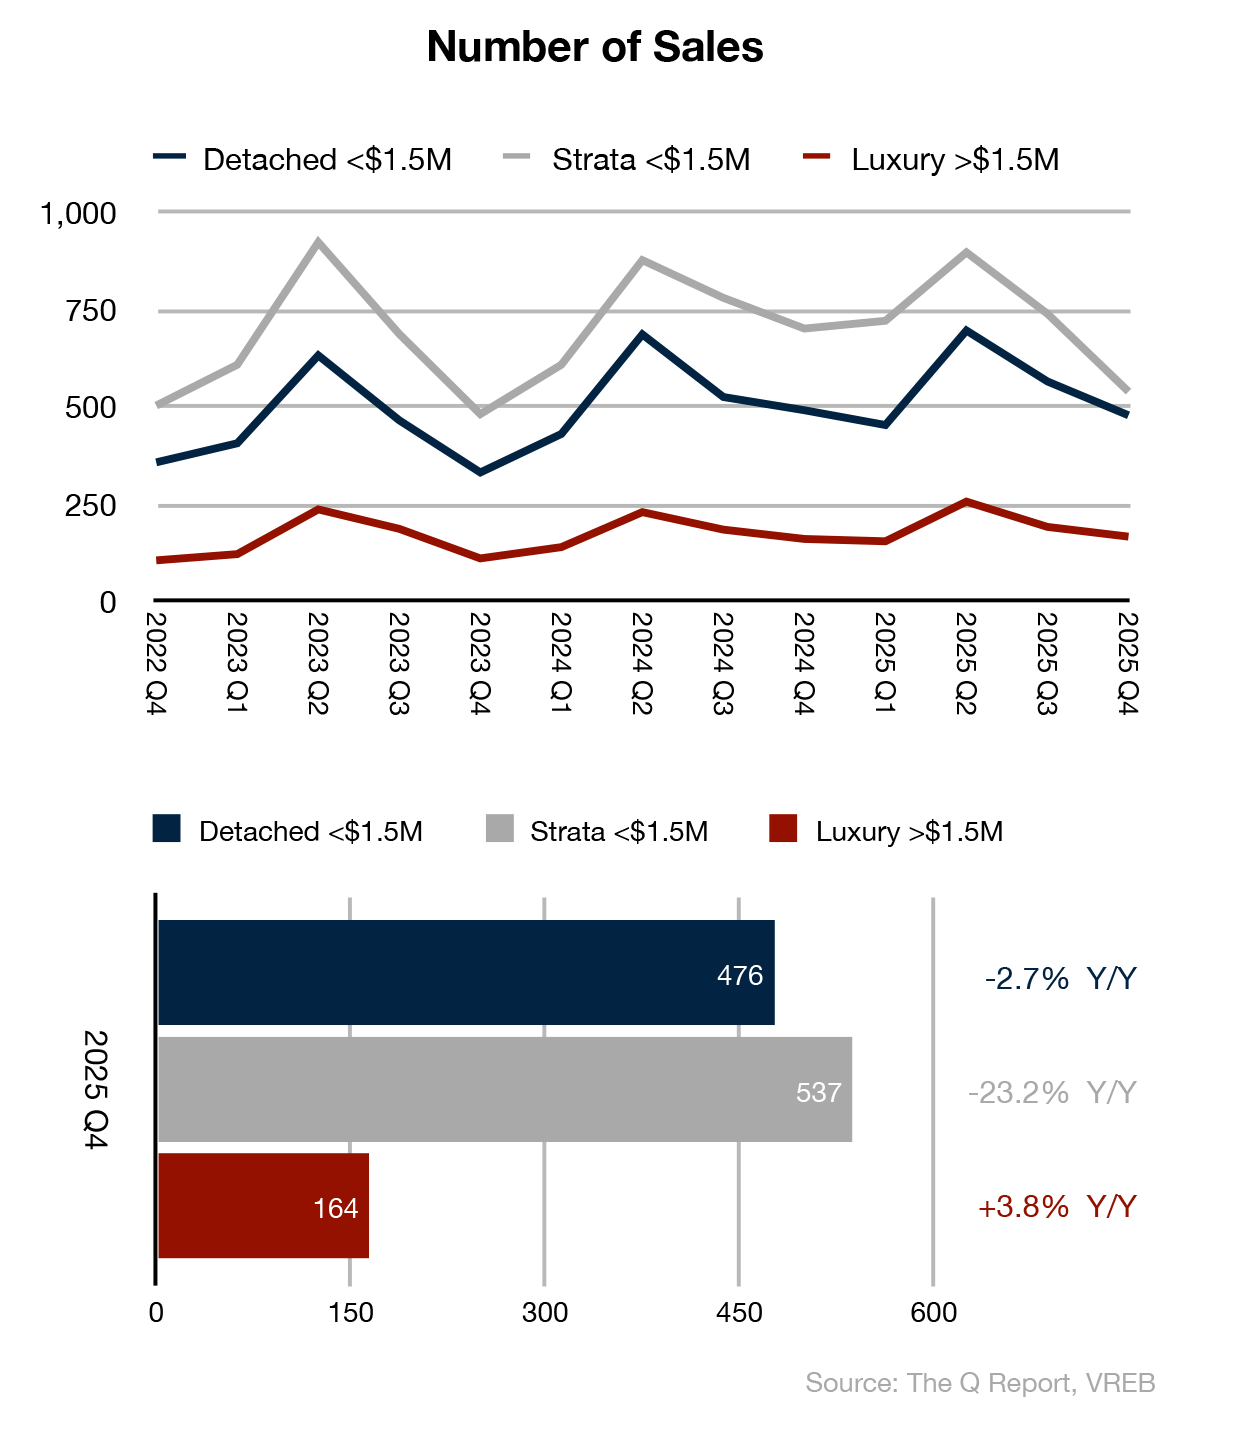
- Strata Sales Decline: The Strata segment (<$1.5M) saw the most significant year-over-year change, with sales volume dropping -23.2% compared to Q4 2024 – a clear signal that affordability pressures and interest rate sensitivity continue to weigh heavily on the entry-level market.
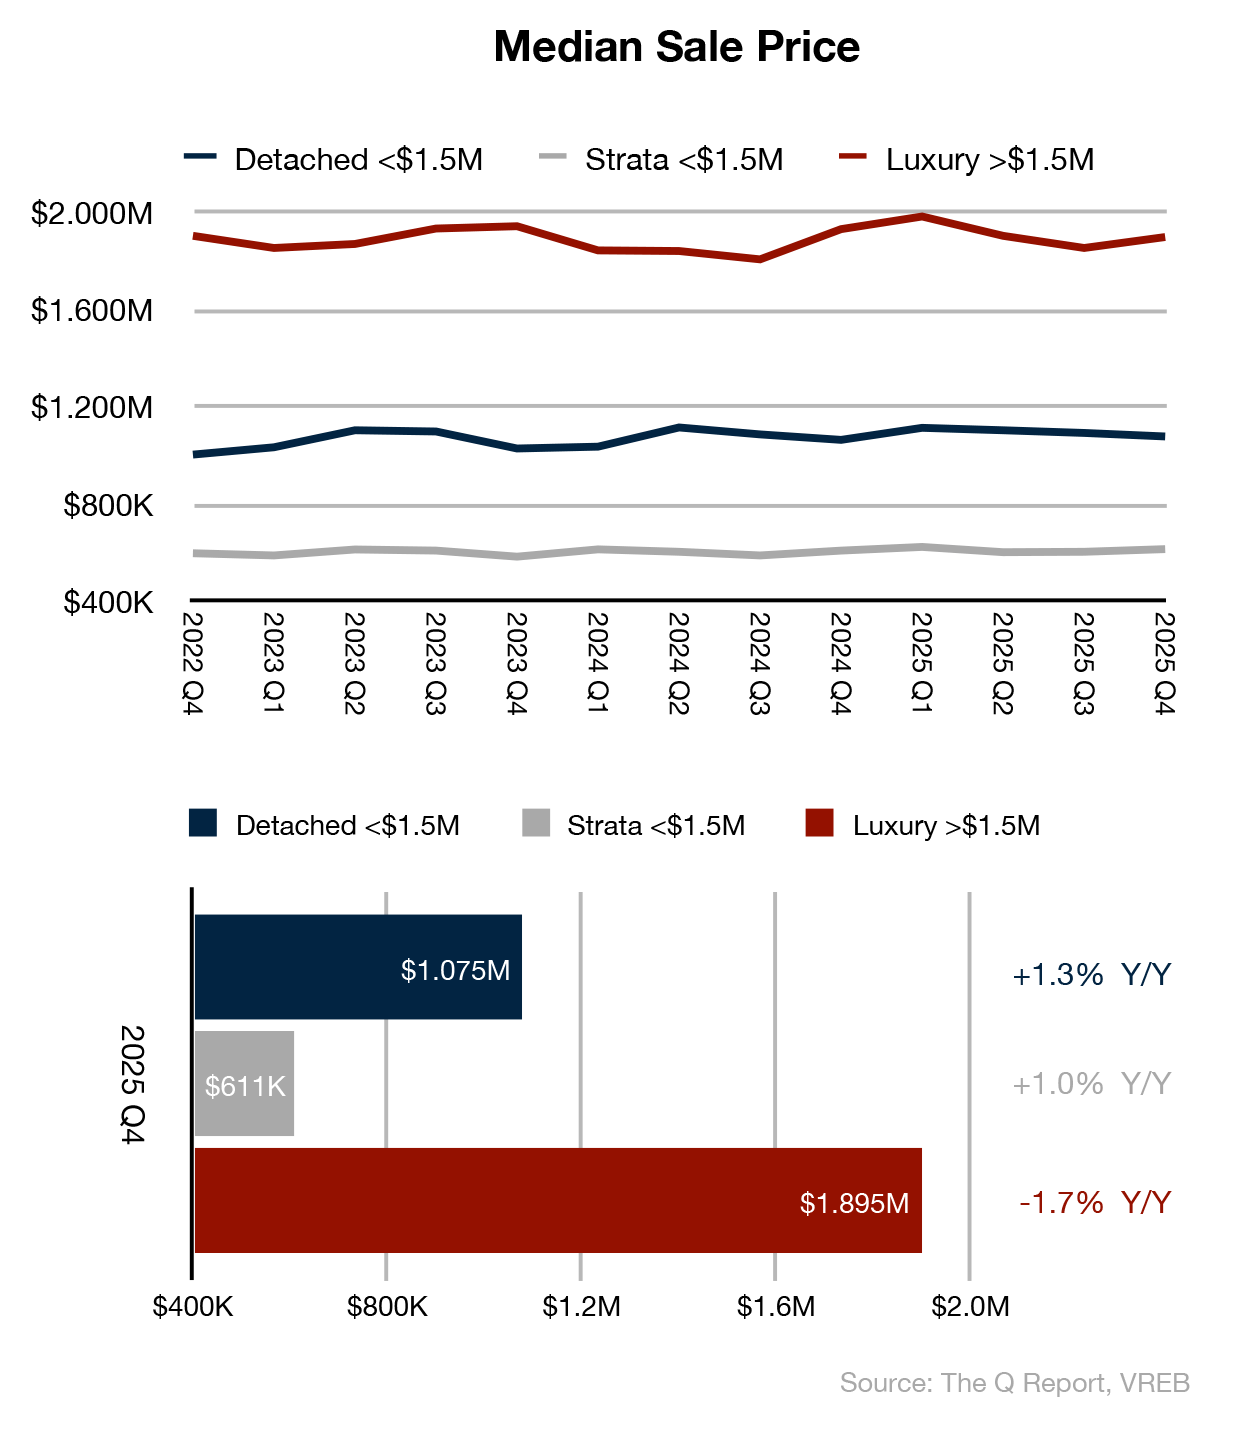
- Price Stability Persists: Despite softening sales volumes, median prices held firm across all segments. Detached homes saw a modest +1.3% year-over-year gain, while Strata prices edged up +1.0%. We note once again how Victoria’s market behaves differently than more volatile areas in B.C. and elsewhere in Canada, reflecting our region’s long-term stability and appeal.
- Luxury Resilience: The Luxury segment (>$1.5M) defied broader trends with sales increasing +3.8% year-over-year, though median prices dipped -1.7%, suggesting buyers are finding some value in the upper market.
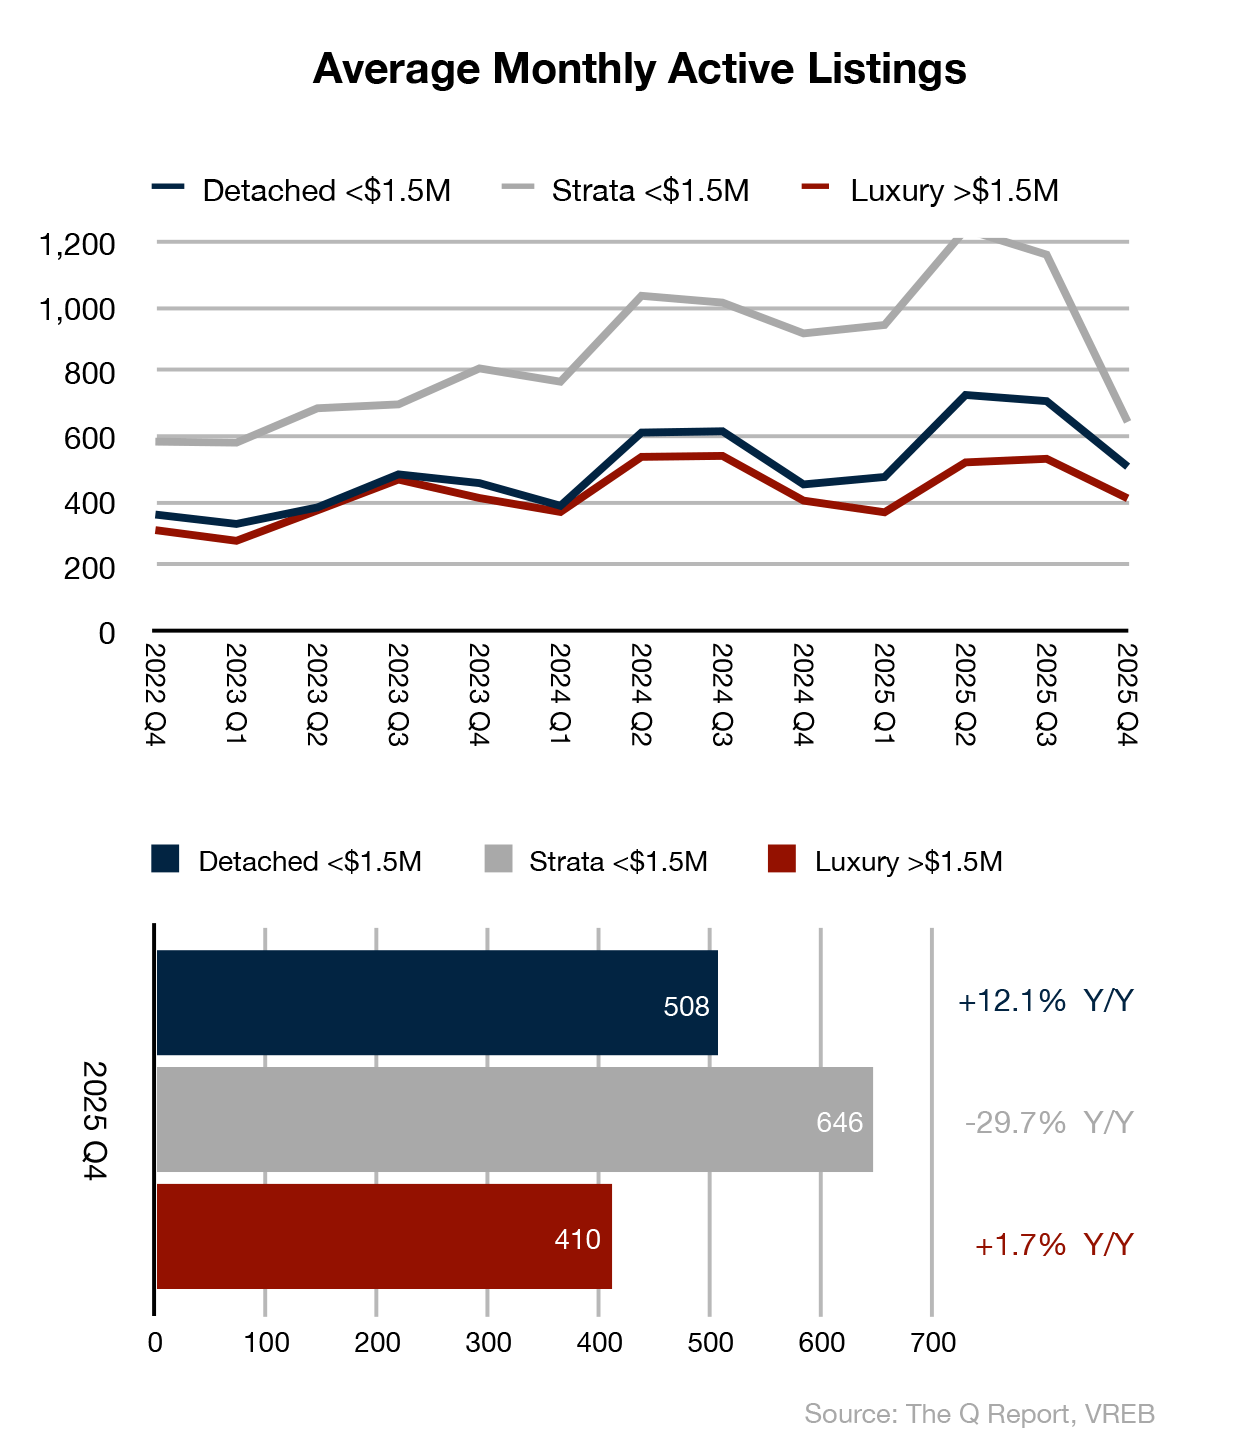
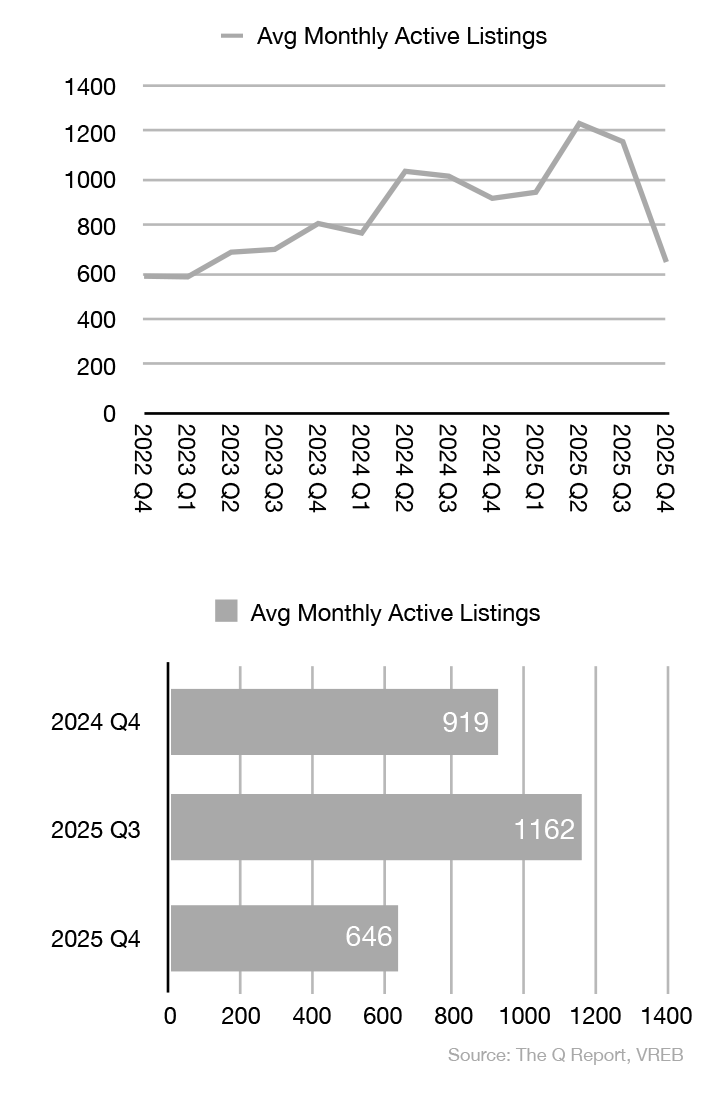
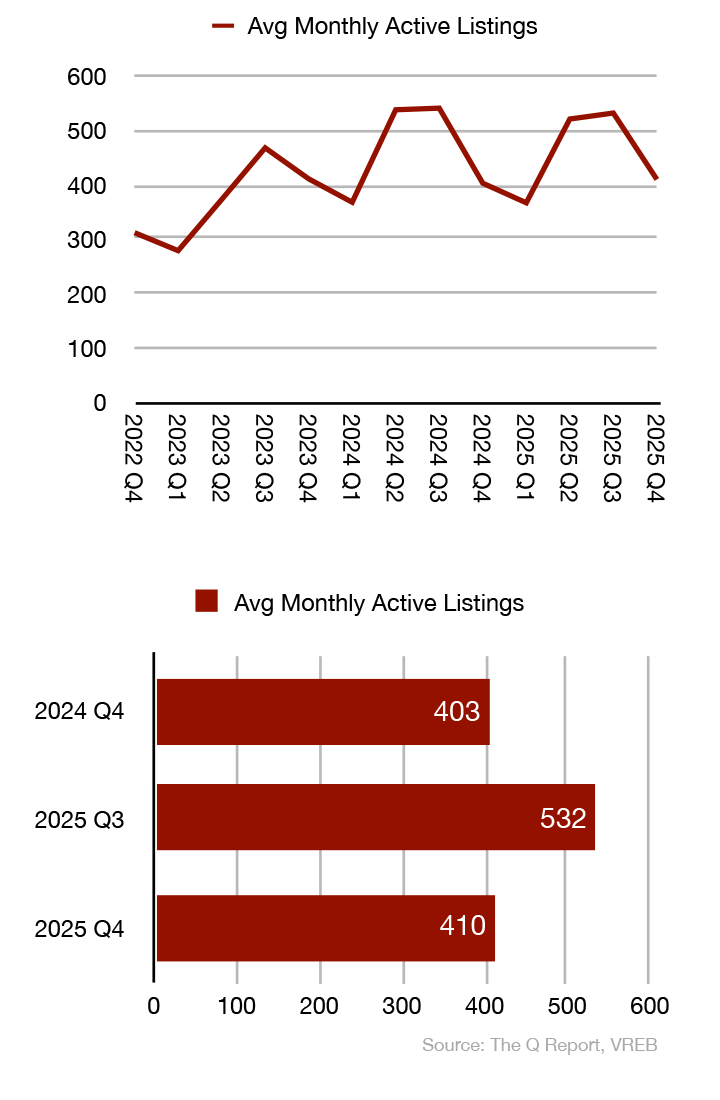
- Inventory Normalization: After peaking in Q2-Q3, average monthly active listings pulled back seasonally. Detached inventory increased +12.1% year-over-year, while Strata listings actually decreased -29.7%from Q4 2024 levels. Increased inventory marks a healthy, stable balance between buyers and sellers. For now; if we see major increases in inventory all year long, days on market will increase and prices will cease to rise.
THE BIG PICTURE: A Year of Recalibration
Q4 2025 closes out a year that saw the Victoria market complete its transition from a seller-dominated environment to one of genuine balance. The data tells a nuanced story:
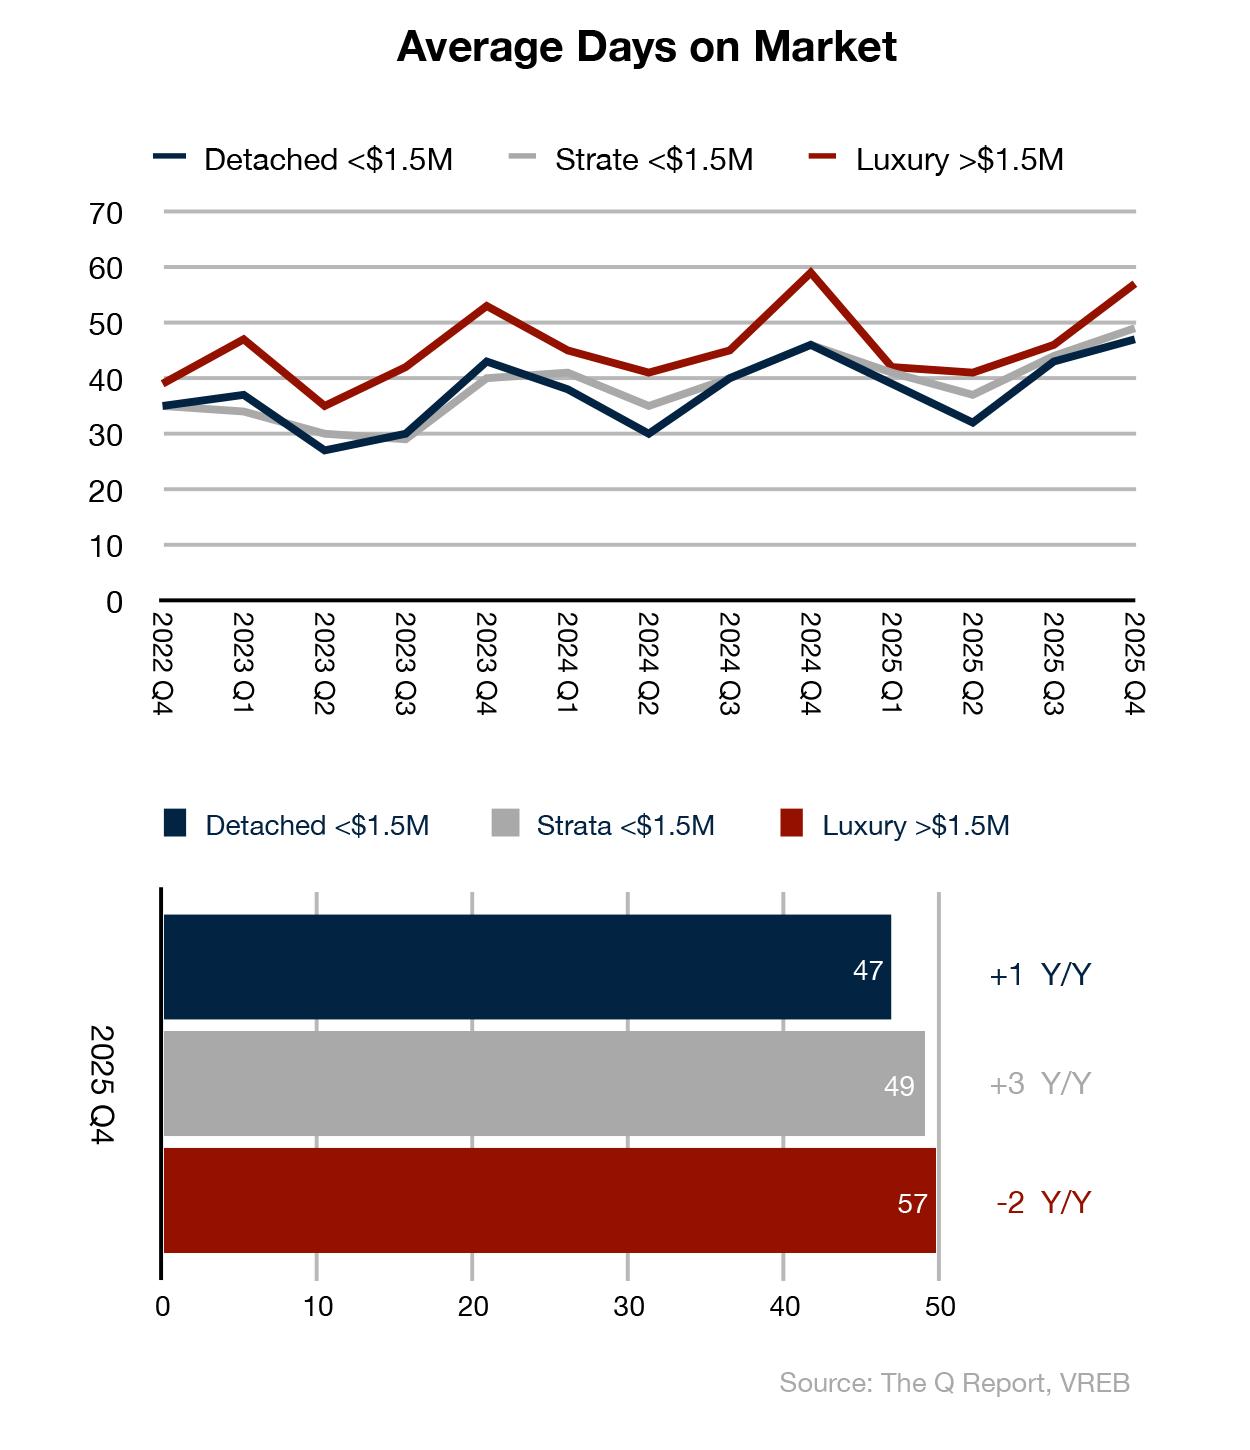
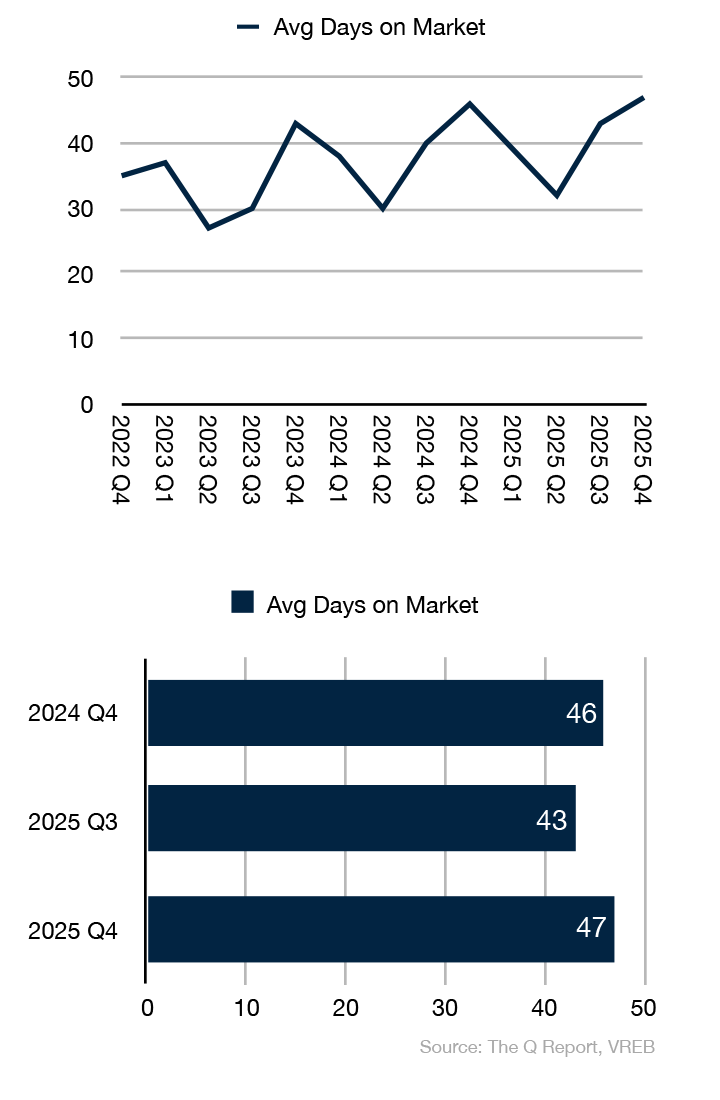
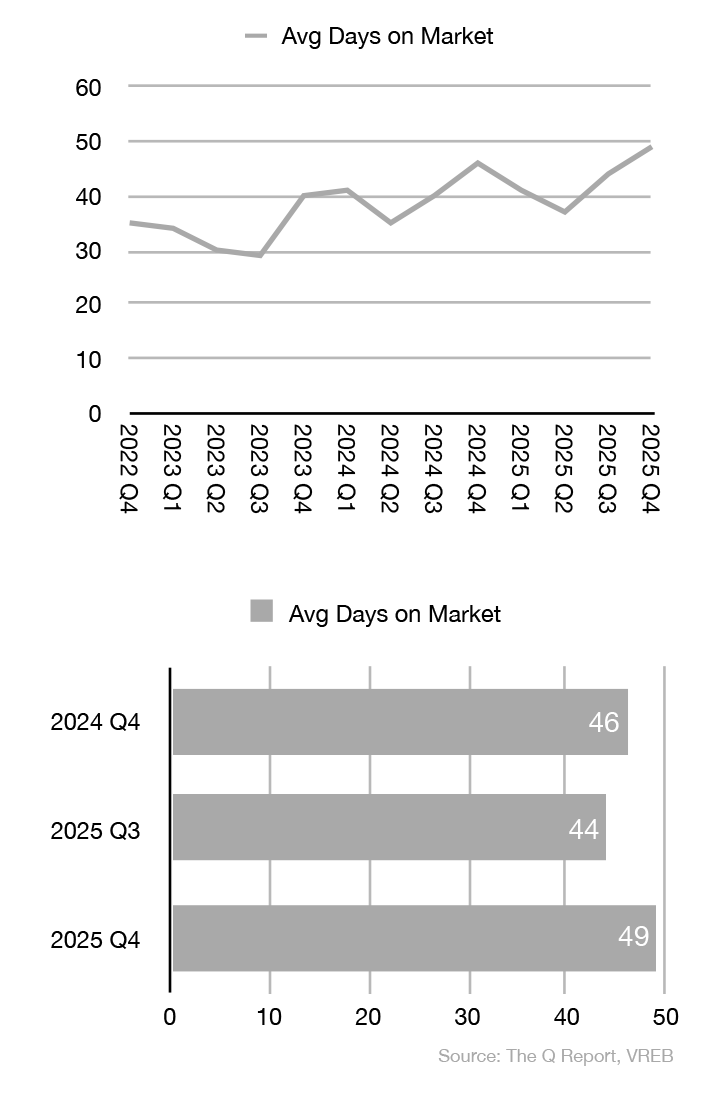
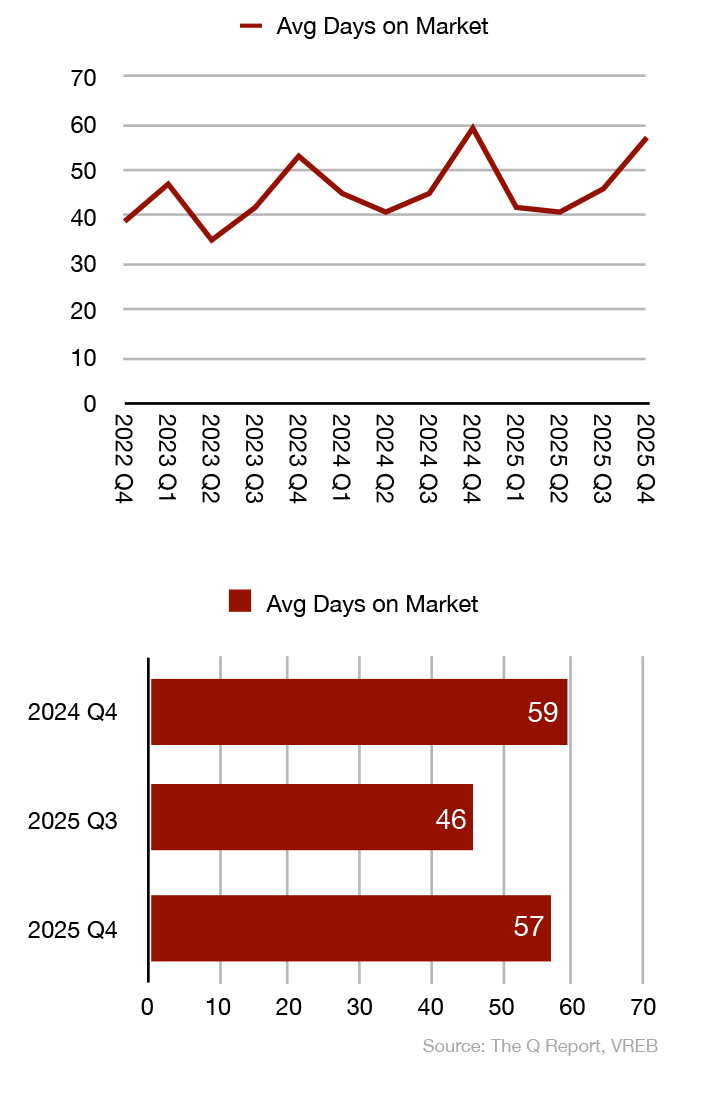
- Days on Market Expansion: Properties are taking longer to sell across all segments. Detached homes averaged 47 days on market (up 1 day Y/Y), Strata units averaged 49 days (+3 Y/Y), and Luxury properties averaged 57 days (-2 Y/Y). This extended timeline gives buyers the due diligence period that was impossible during the peak market years.
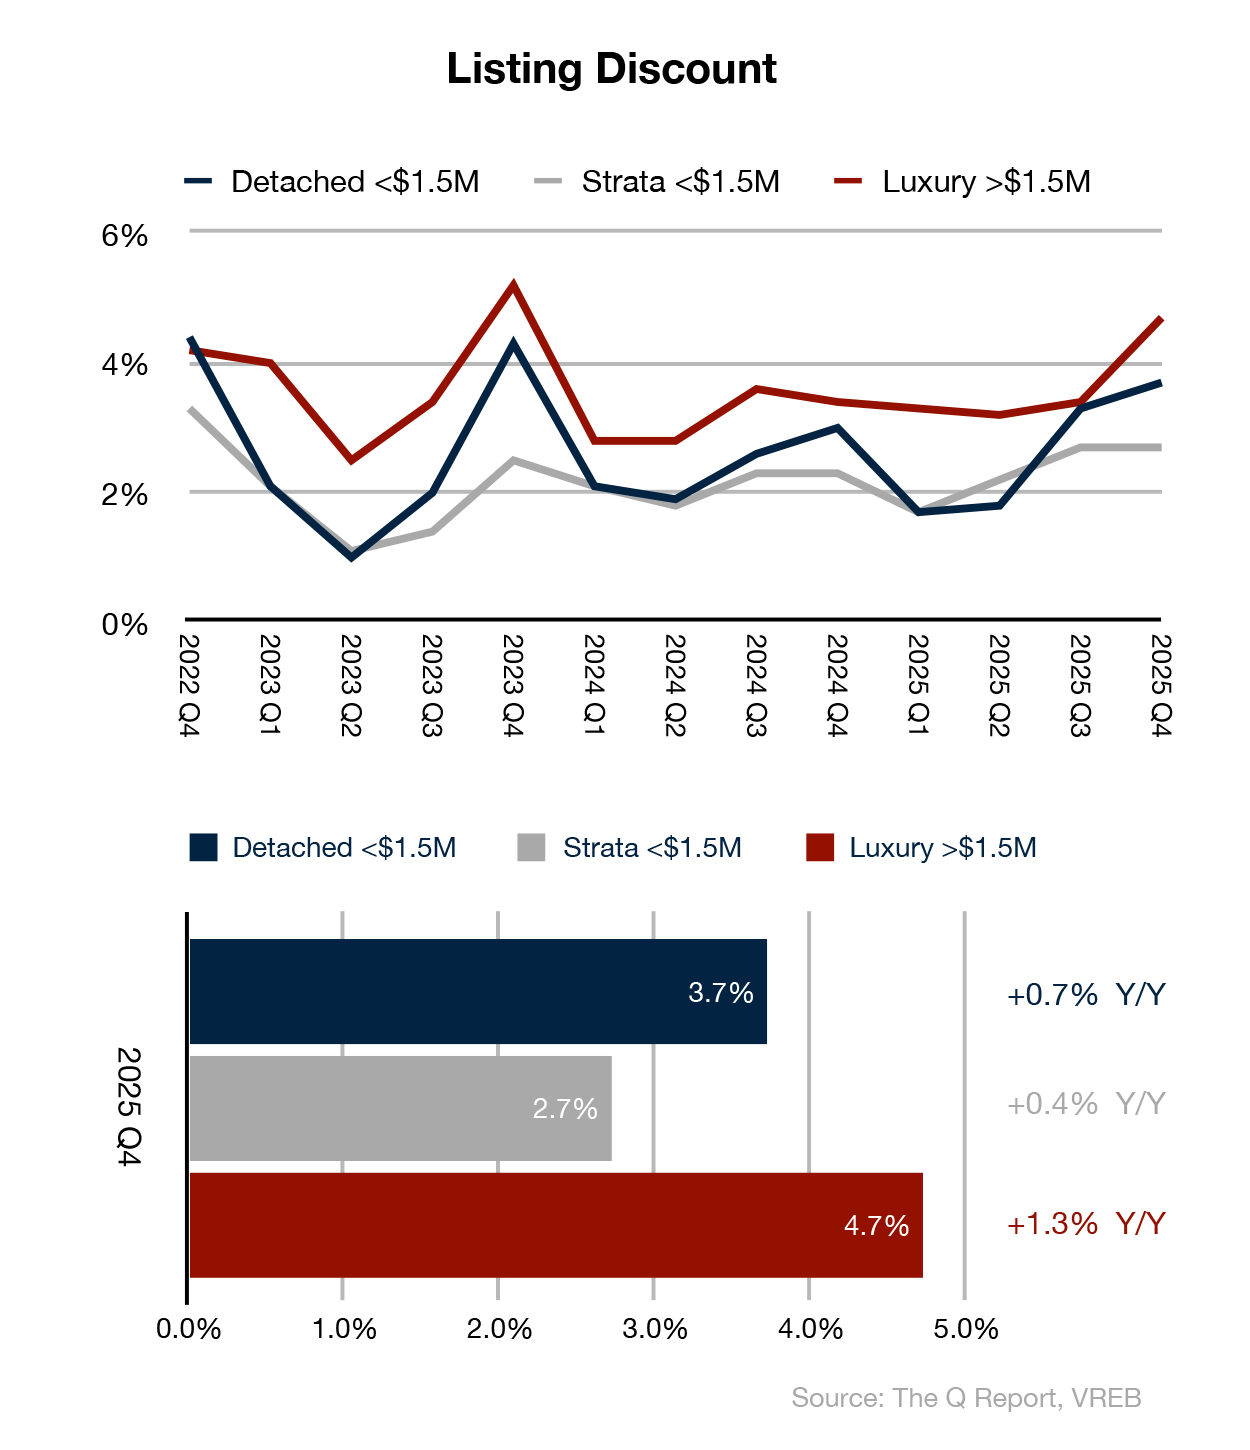
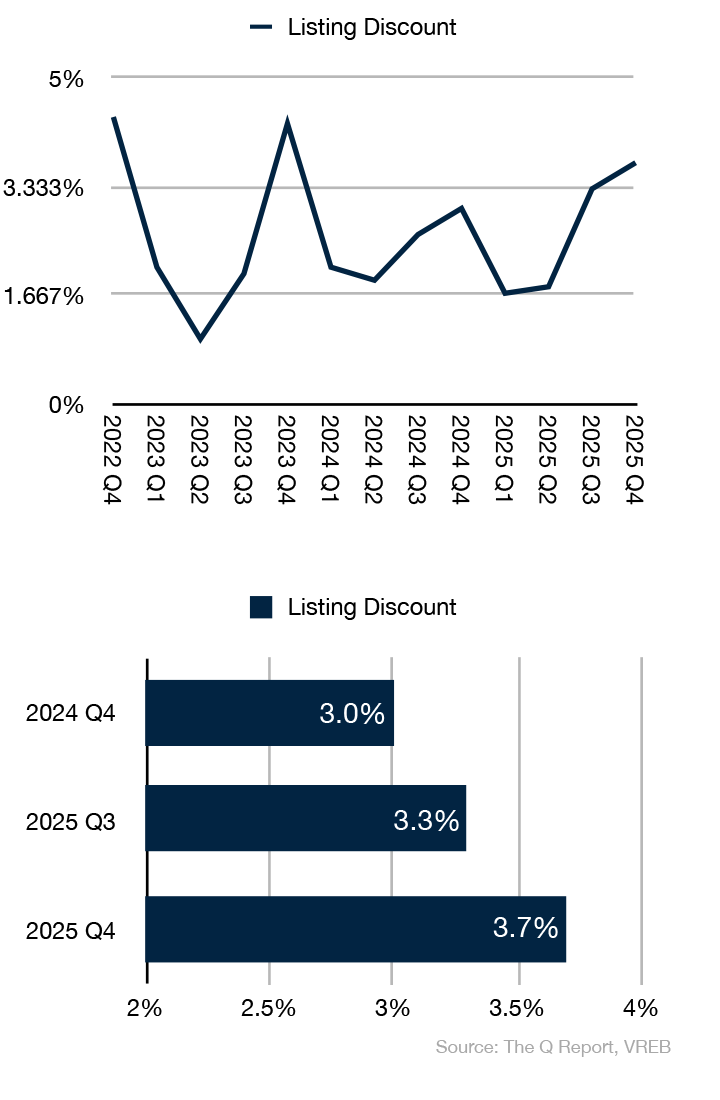
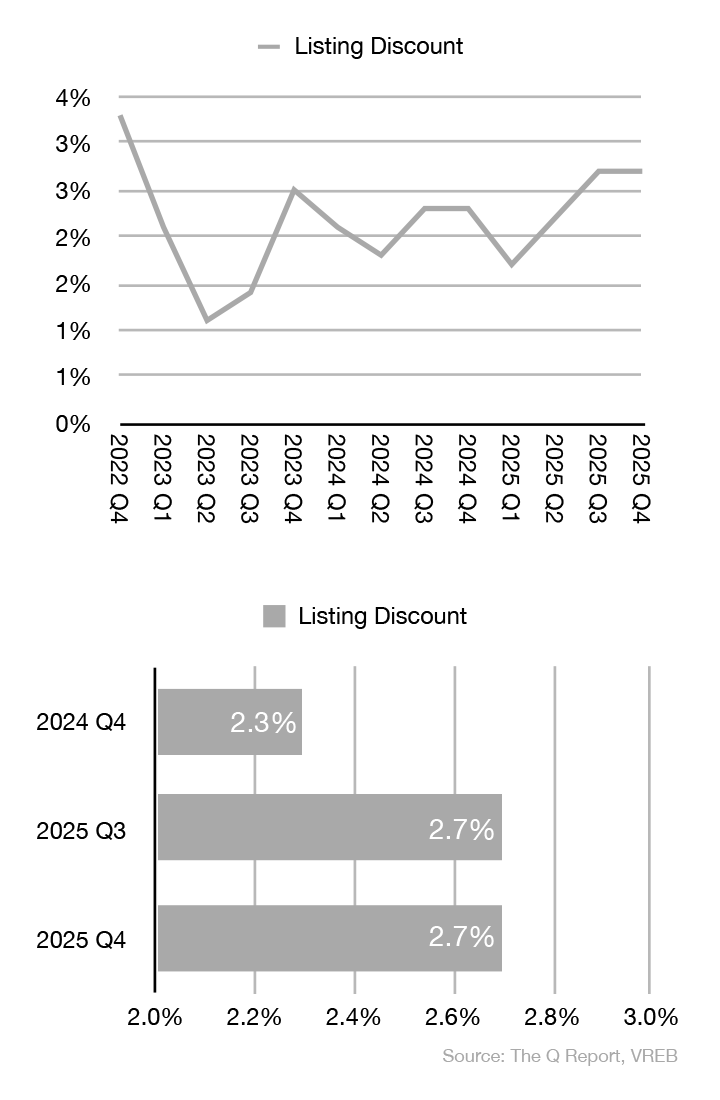
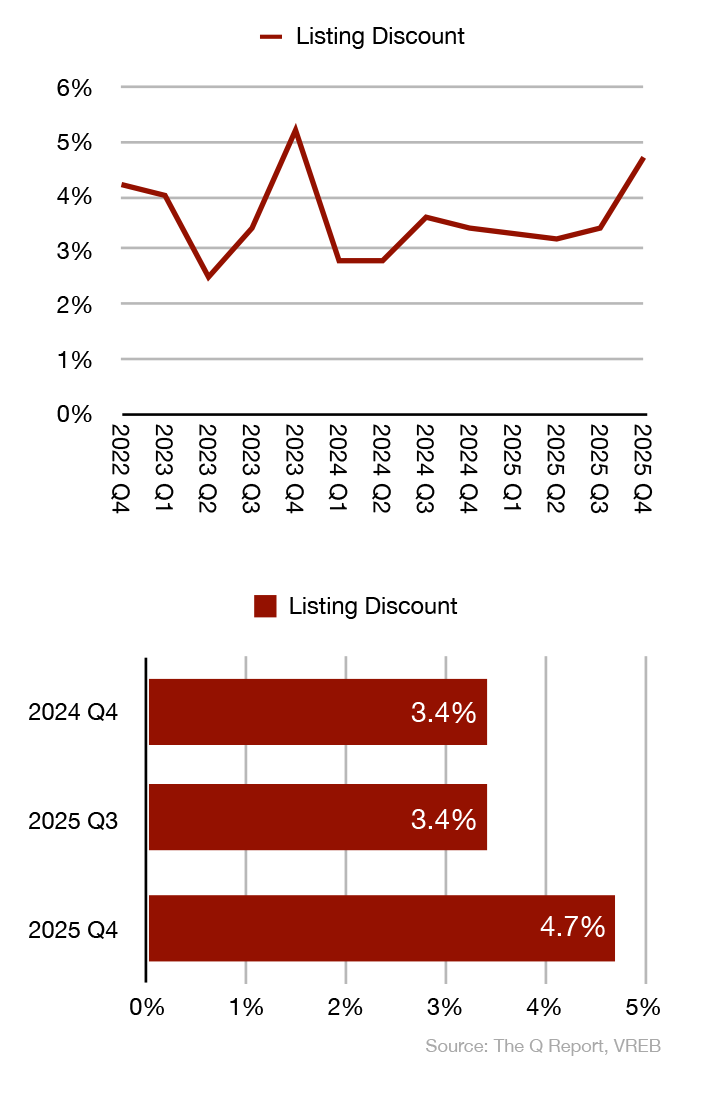
- Listing Discounts Widening: Sellers are increasingly accepting offers below their original asking price. The listing discount for Detached homes reached 3.7% (up 0.7% Y/Y), while Luxury properties saw discounts widen to 4.7% (up 1.3% Y/Y) – a clear indicator that pricing accuracy is more critical than ever.
Detached Homes, <$1.5M
The Detached Market: Stability Amid Seasonal Slowdown
The single-family market demonstrated remarkable price resilience despite a typical Q4 slowdown in transaction volume.
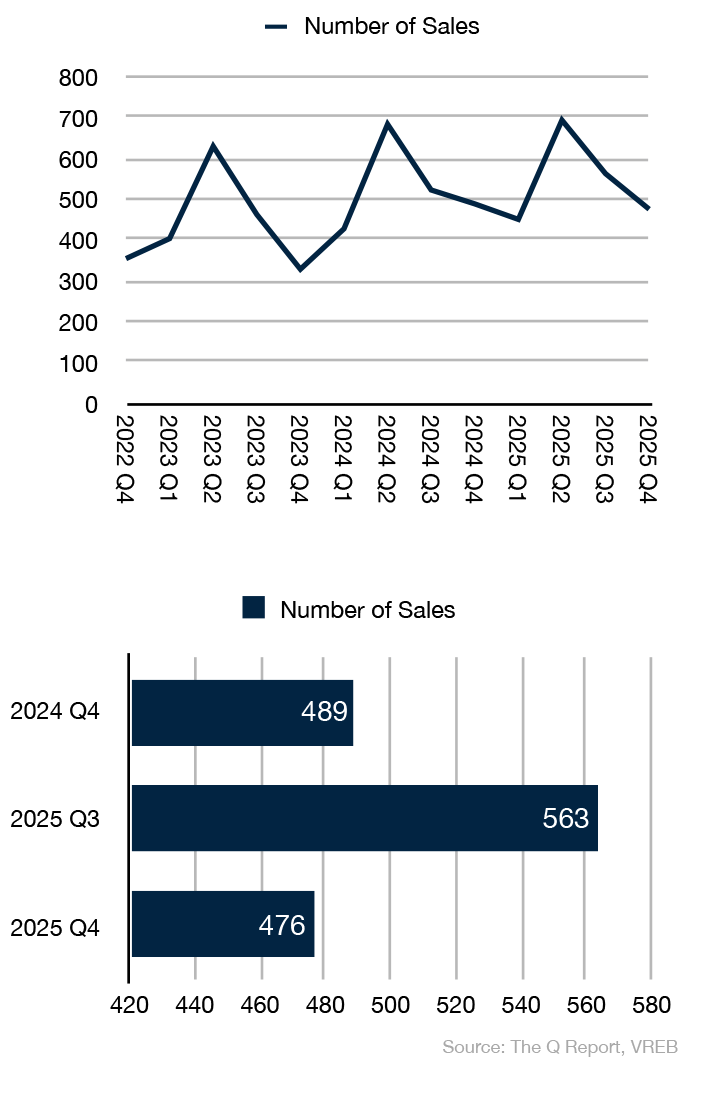
- Sales Activity: 476 detached homes (<$1.5M) sold in Q4 2025, down -15.5% from Q3 but only -2.7% below Q4 2024 levels. This modest year-over-year decline suggests the market has found a sustainable pace of activity.
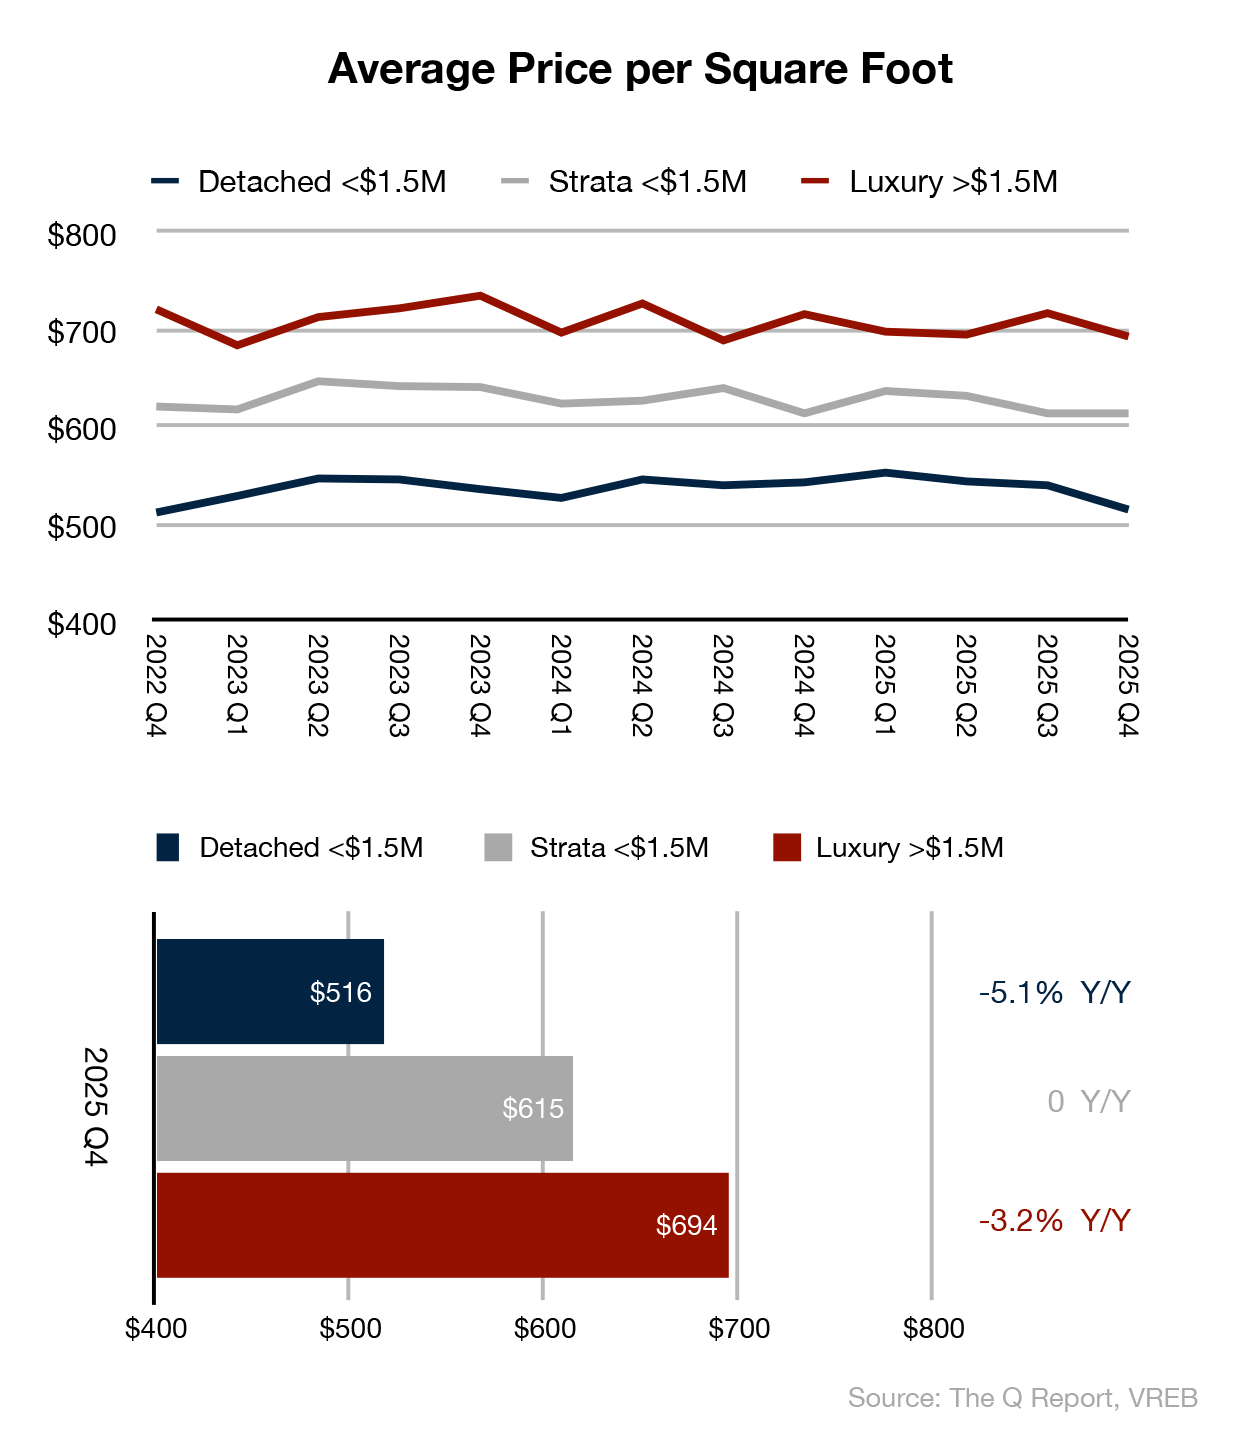
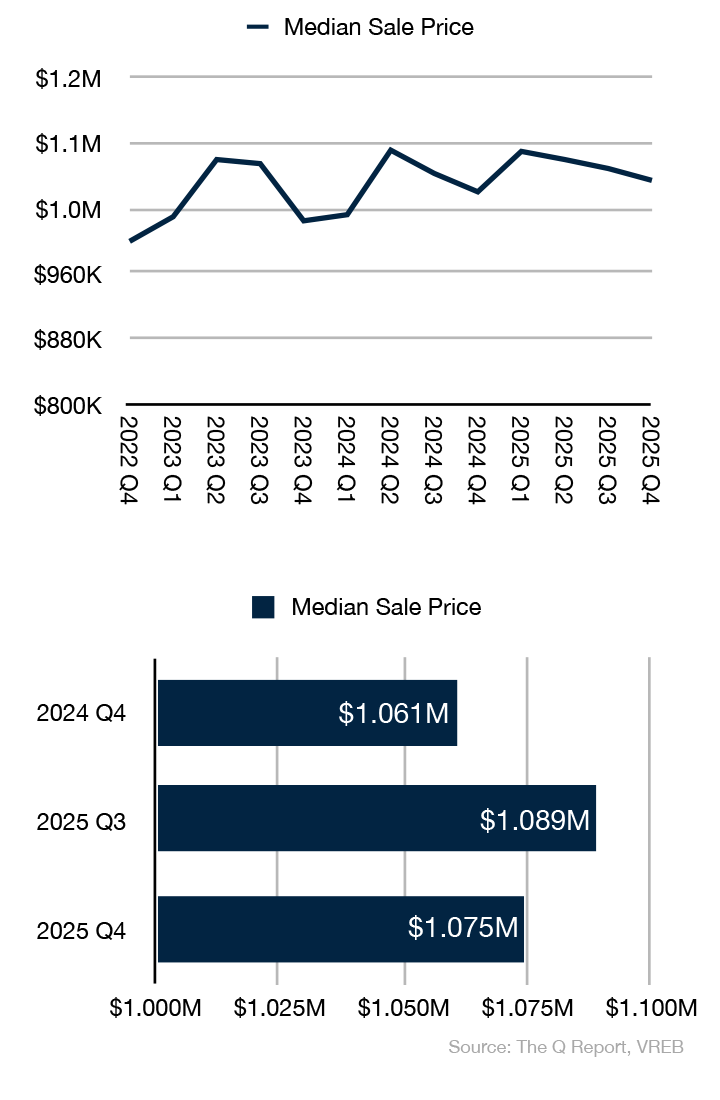
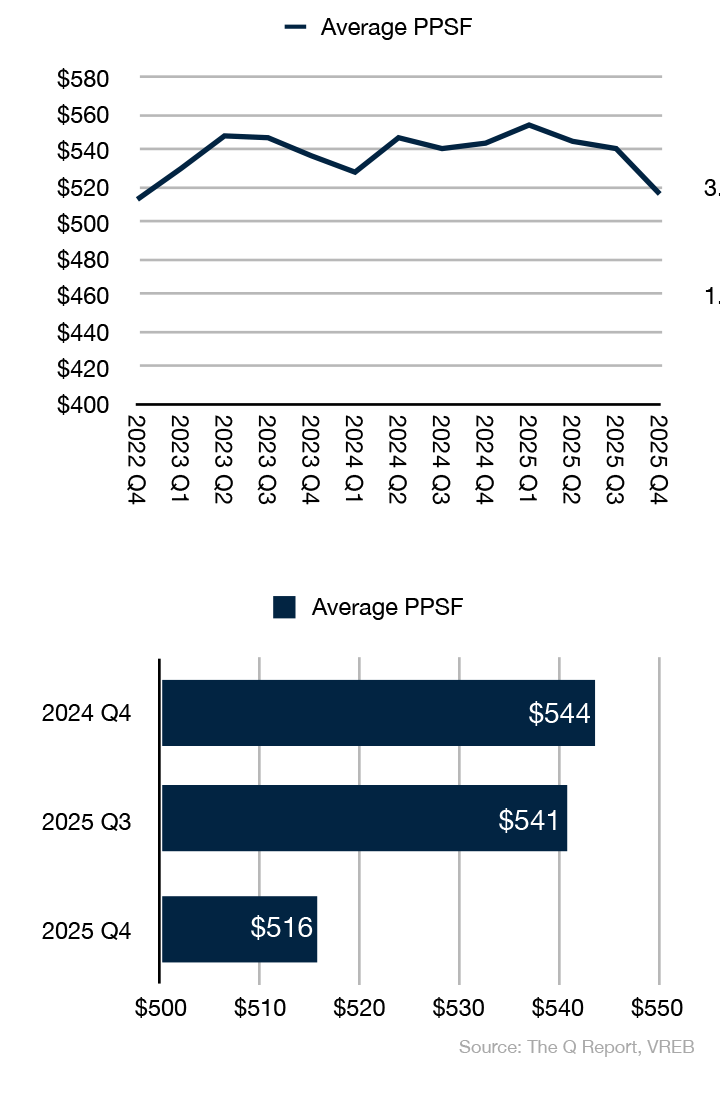
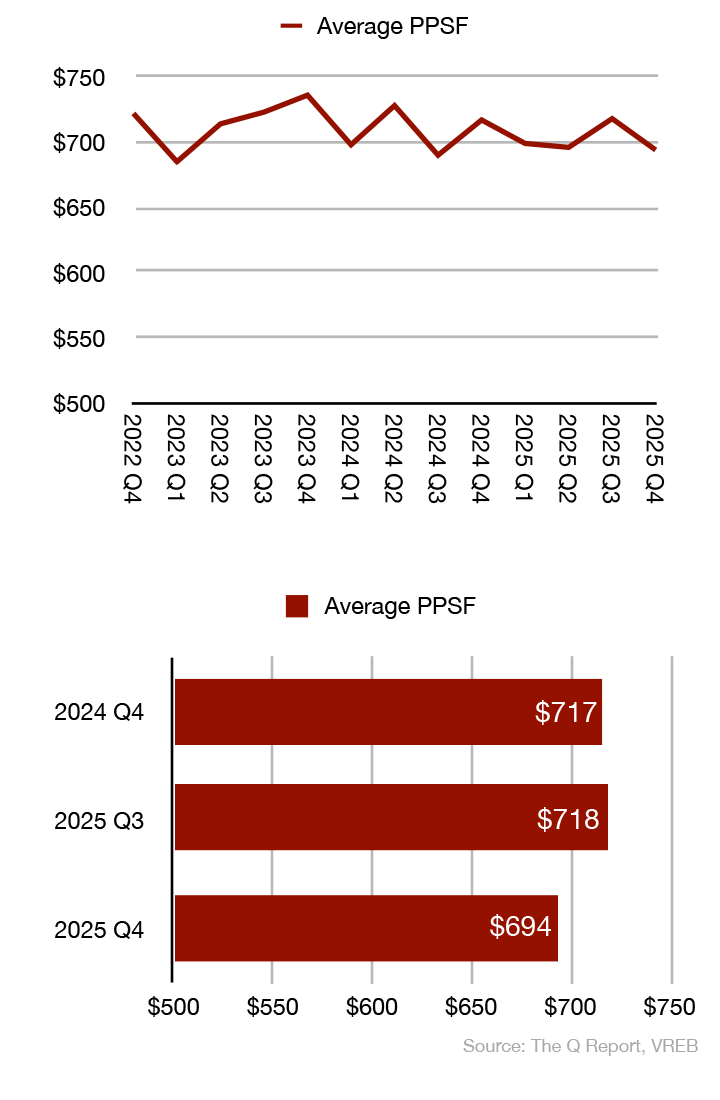
- Price Performance: The median sale price of $1,074,500 represents a +1.3% year-over-year increase, demonstrating that the detached segment continues to hold value even as other metrics soften. The price per square foot declined to $516 (-5.1% Y/Y), indicating that buyers are capturing more space for their dollar.
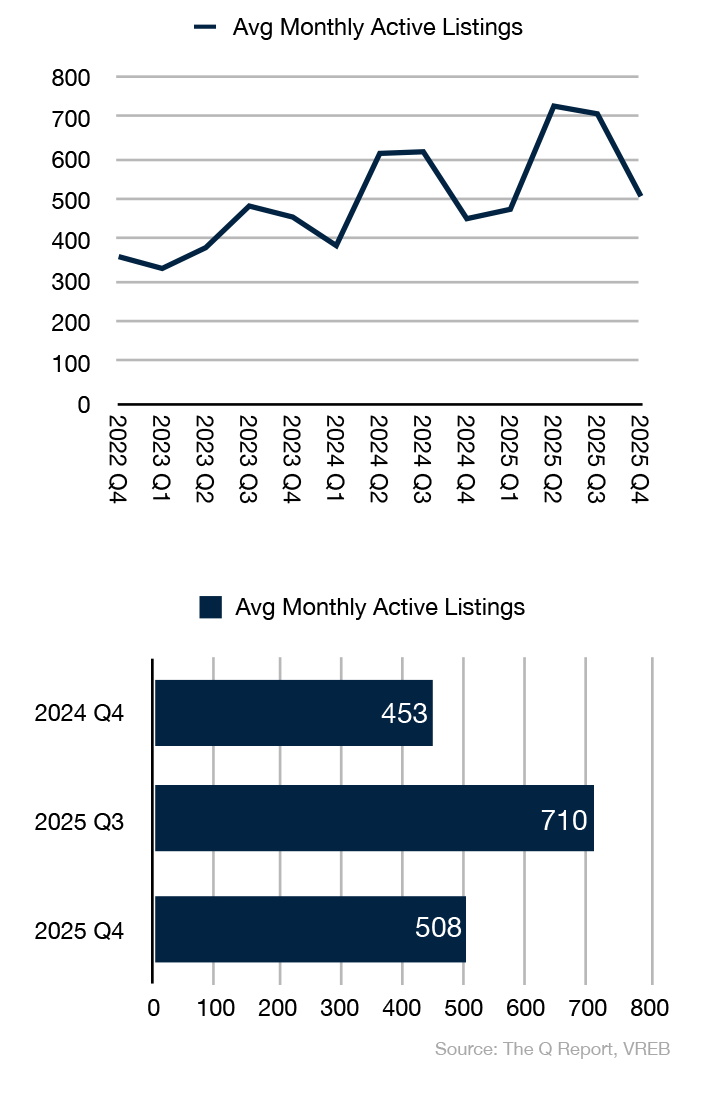
- Inventory Dynamics: Average monthly active listings of 508 represent a +12.1% increase from Q4 2024, providing buyers with meaningful selection while remaining within balanced market parameters.
Strata Homes, <$1.5M
The Strata Market: Navigating Affordability Pressures
The condominium and townhome segment showed the clearest evidence of buyer hesitation, with sales volumes declining significantly while prices held steady.
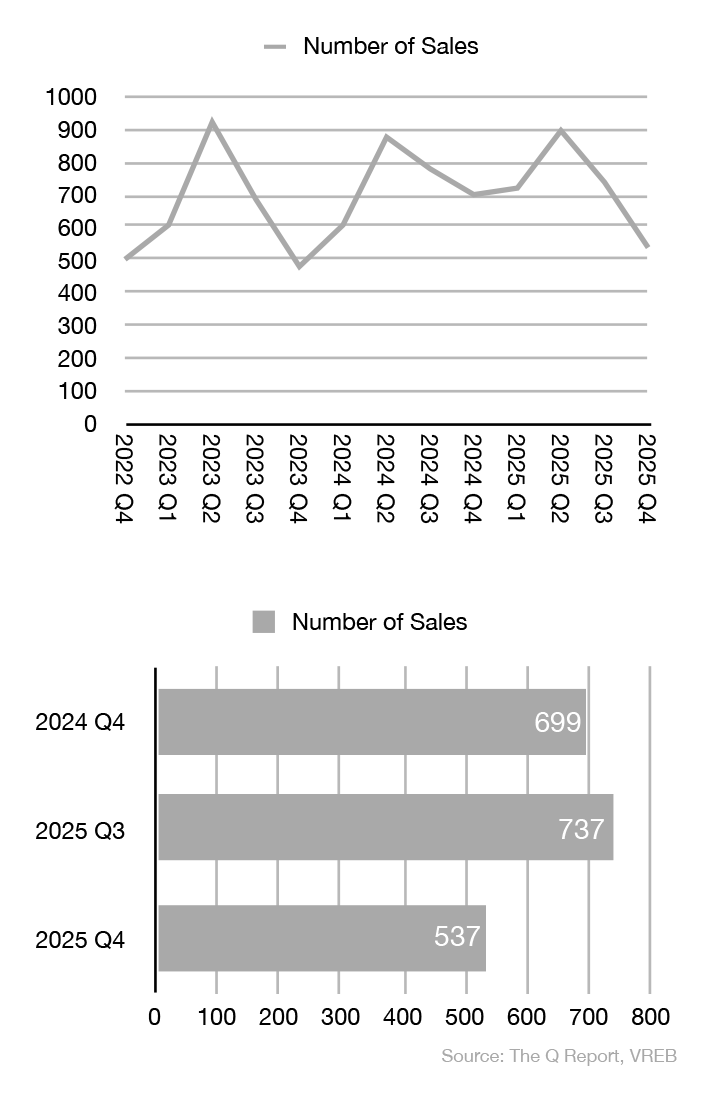
- Sales Contraction: With only 537 strata sales in Q4 2025, volume dropped -27.1% quarter-over-quarter and -23.2% year-over-year – the most significant decline across all segments. This reflects the compounding effects of interest rate sensitivity and affordability constraints at the entry level.
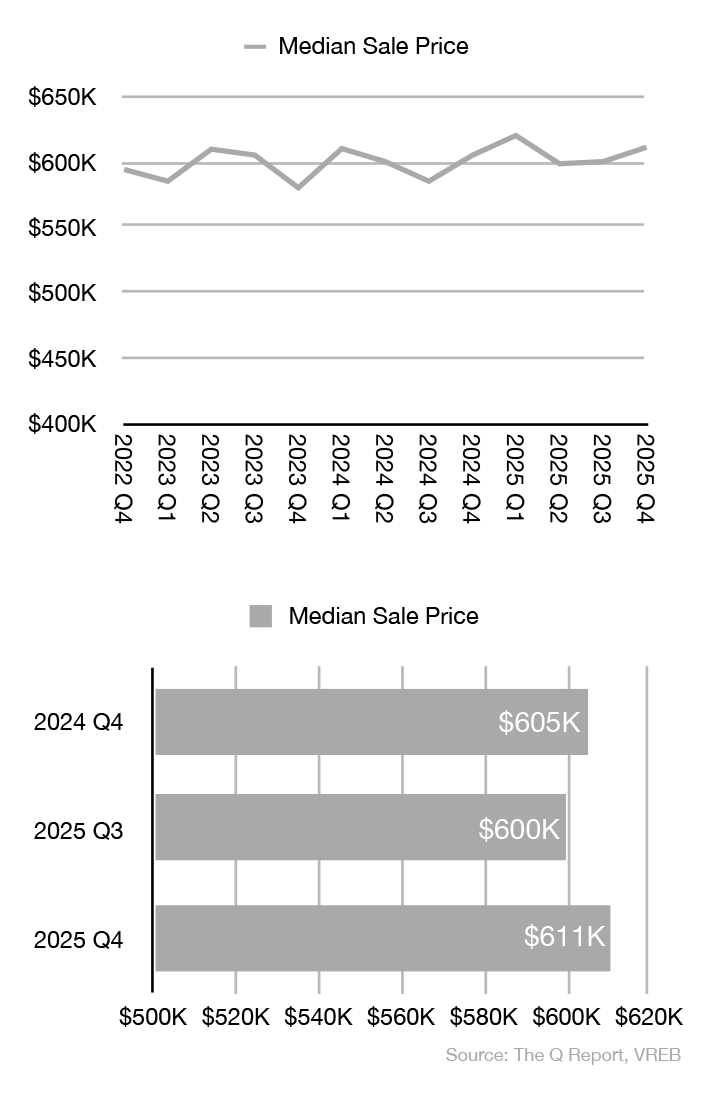
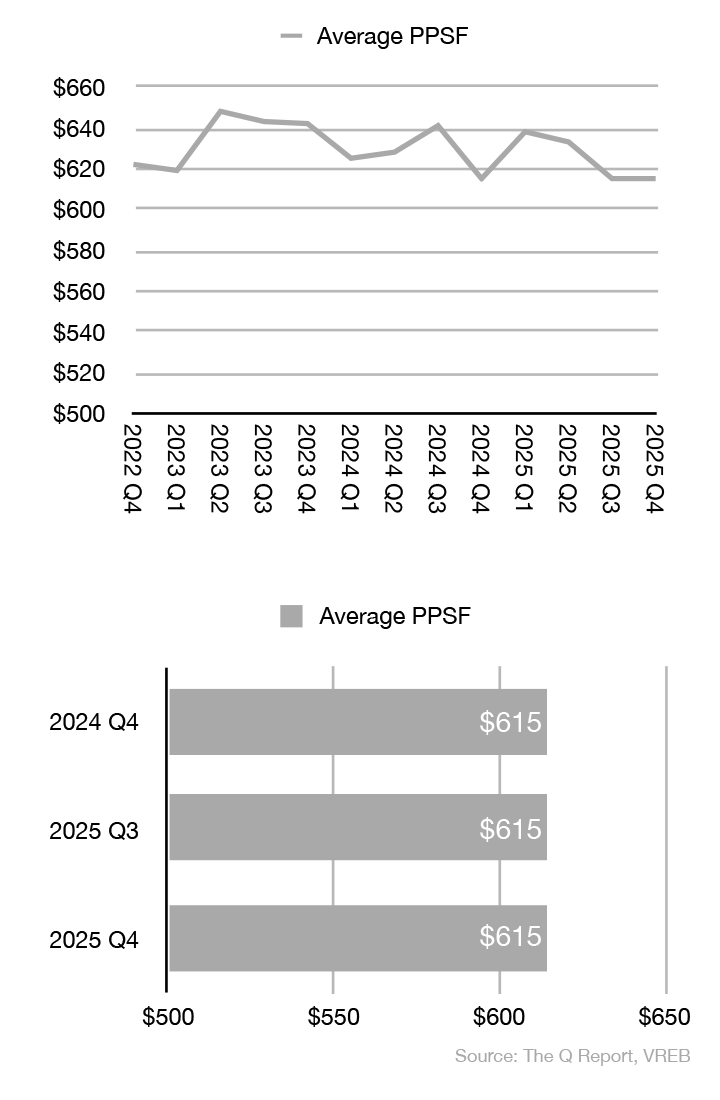
- Price Stability: Despite weak sales volumes, the median sale price of $611,000 actually increased slightly at +1.8% from Q3 and +1.0% year-over-year. The price per square foot remained flat at $615, unchanged from both Q3 and Q4 2024.
- Inventory Correction: Average monthly active listings fell dramatically to 646, down -44.4% from Q3 and -29.7% from Q4 2024. This suggests sellers who couldn’t find buyers have pulled their listings, which may set the stage for tighter conditions if demand rebounds. In all likelihood though, much of this inventory will reappear in 2026.
Luxury Homes, >$1.5M
The Luxury Market (>$1.5M): Selective Buying, Strategic Pricing
The luxury segment continues to operate by its own rules, with patient buyers finding opportunities while sellers adjust expectations.
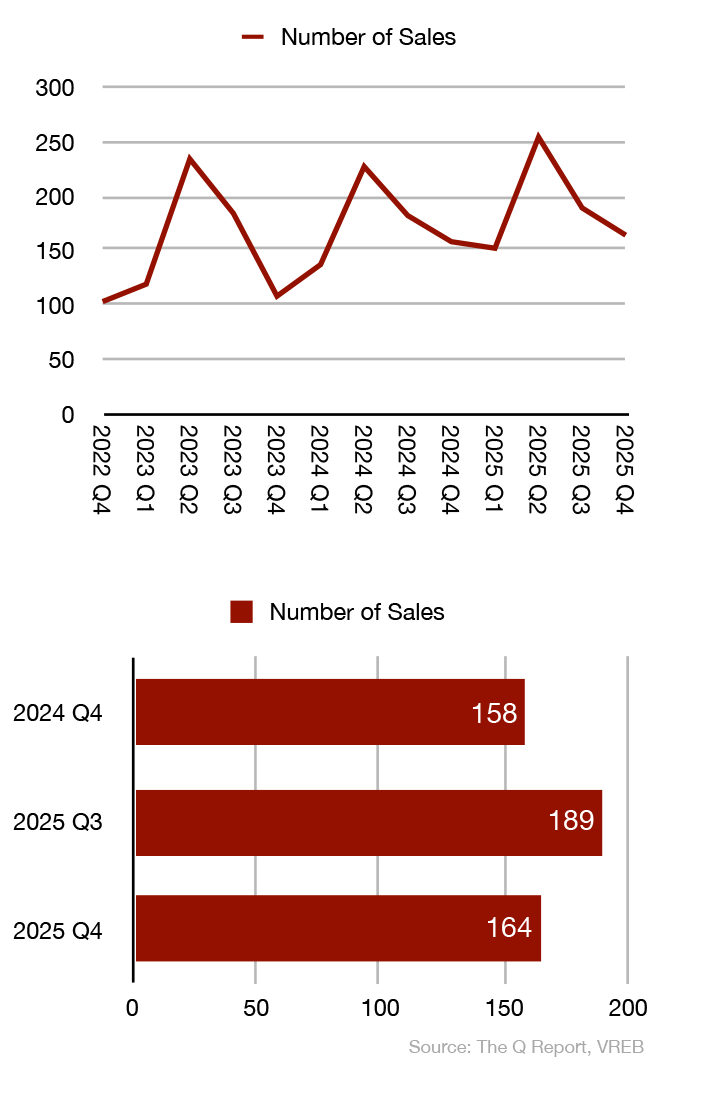
- Sales Volume: 164 luxury properties sold in Q4 2025, down -13.2% from Q3 but up +3.8% year-over-year. This counter-cyclical performance suggests that affluent buyers are less sensitive to interest rate pressures and are taking advantage of improved selection.
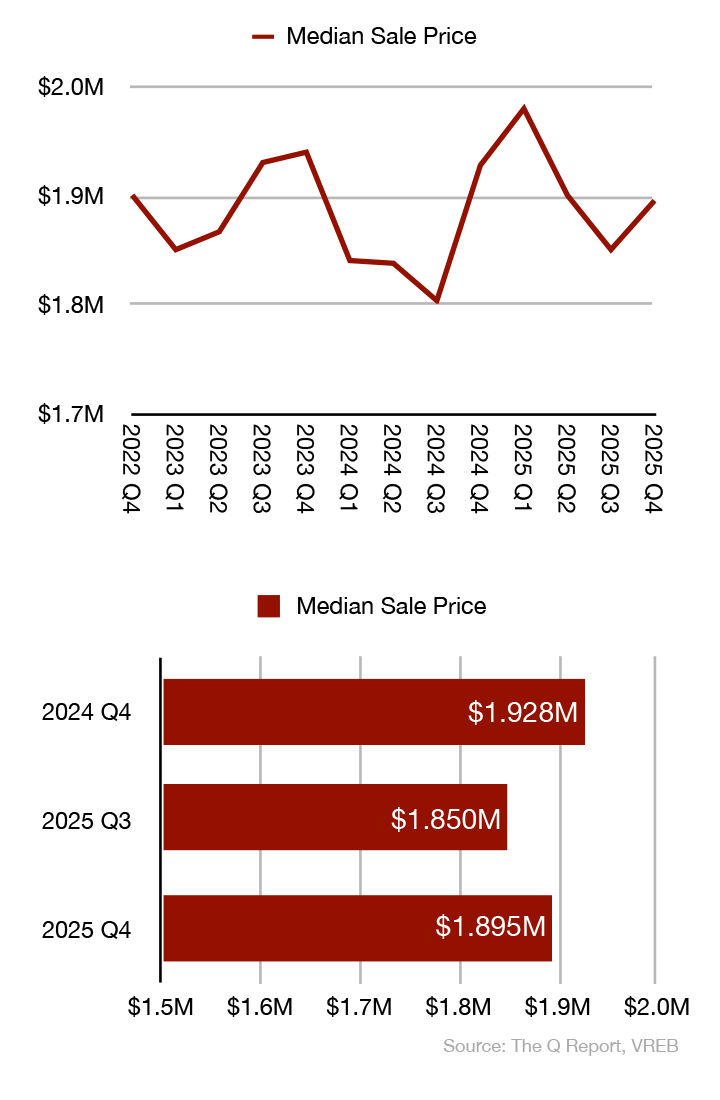
- Pricing Dynamics: The median sale price of $1,895,000 increased +2.4% quarter-over-quarter but declined -1.7% year-over-year. The widening listing discount of 4.7% (up 1.3% Y/Y) confirms that aggressive pricing strategies are being punished in this segment.
- Extended Timelines: Luxury properties averaged 57 days on market, down 2 days from Q4 2024 but up 11 days from Q3 2025. The quarterly increase reflects the typical seasonal slowdown, but the year-over-year improvement points to efficiency gains for properly priced properties.
HPI® TRENDS
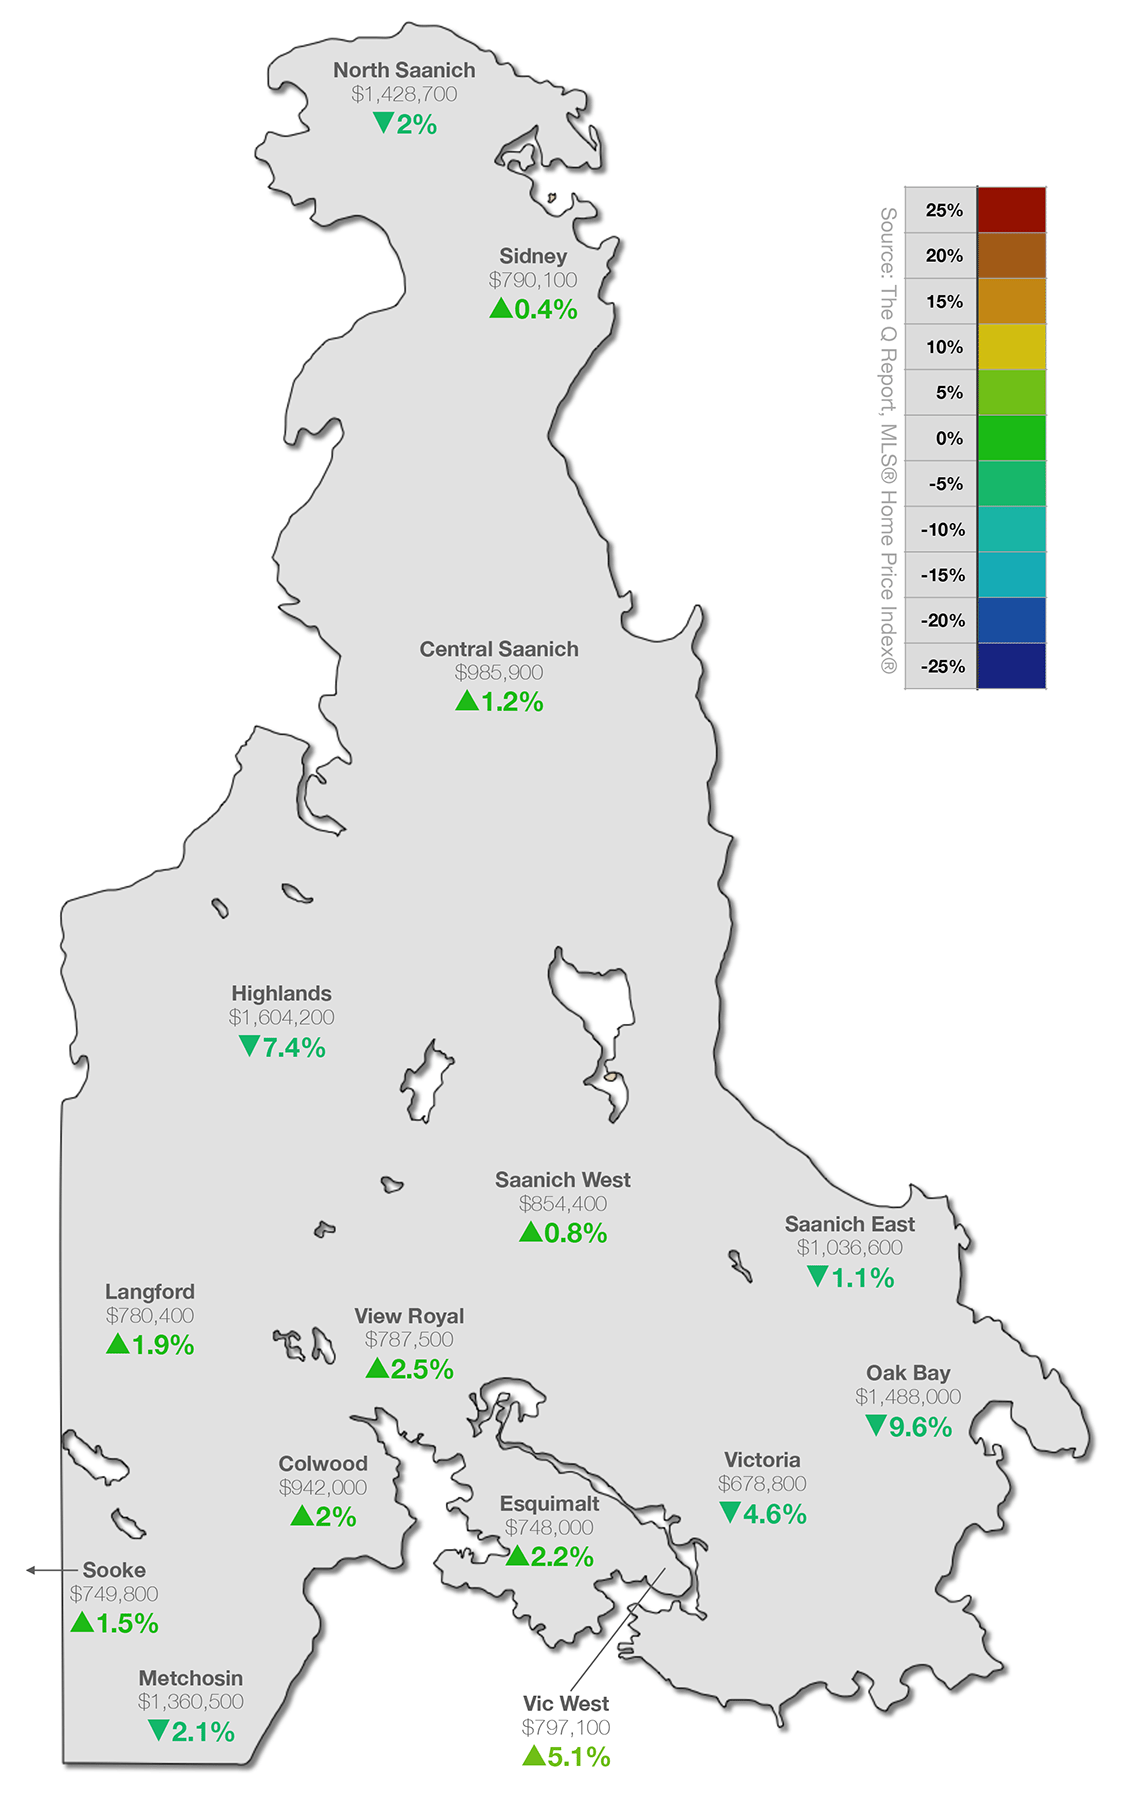
The MLS® Home Price Index® (MLS® HPI®) is purpose-built to gauge neighbourhoods’ home price levels and trends, using more than a decade of sales data and sophisticated statistical models to define a “typical” home based on the value home buyers assign to various attributes on homes that have been bought and sold. These benchmark homes are tracked across localized neighbourhoods and different types of houses. The Q Report’s HPI® trends compares relative regional price movements around Greater Victoria by tracking the HPI® Composite Benchmark Price across 15 districts, comparing Y/Y price changes.
HPI ANALYSIS: A Market of Two Stories
The MLS® Home Price Index map reveals a clear divergence between appreciation and depreciation across Greater Victoria’s sub-markets.
- Winners: Vic West leads all districts with a +5.1% year-over-year HPI Benchmark gain to $797,100, followed by View Royal (+2.5% to $787,500) and Esquimalt (+2.2% to $748,000). These traditionally more affordable areas continue to attract buyers seeking value close to the urban core.
- Under Pressure: Oak Bay saw the steepest decline at -9.6% to a composite benchmark of $1,488,000, followed by Highlands (-7.4% to $1,604,200) and Victoria proper (-4.6% to $678,800). Premium neighborhoods are experiencing the most significant corrections as buyers reassess value propositions in the upper price tiers.
- Stable Middle: Most Peninsula and Westshore communities showed modest gains of 1-2%, suggesting these areas have found equilibrium after the volatility of recent years.
FORWARD VIEW: Q1 2026
We anticipate 2026 will open with measured activity; the spring market will be the true test of where buyer demand stands after a year of recalibration.
For sellers, accurate pricing based on current comparables – not aspirational values from 2022 – will be essential. For buyers, the window of selection and negotiation leverage that opened in 2025 remains wide open. Even though the dramatic inventory surges of mid-year normalized by year end, we would not be surprised to see listings surge as the spring market of 2026 approaches.
If you are thinking about making a move this year, do you think being well-informed, and having customized data insights would help you make the right decisions along the way? Get in touch now, book a no-hassle, no-obligation meeting and get our market insights working for you. We are only a click or call away.
Do you or someone you know need real estate advice, personalized market insights, a home marketed and sold using the best tools and accurate data? We are available to be your personal resource. Get in touch.
Subscribe, follow us on your favourite social platform, and reach out any time.
Dirk VanderWal & Fergus Kyne
Newport Realty Ltd.
(250) 385-2033 | info@victoriaqreport.com
Notes
All views and opinions expressed in The Q Report are solely those of its authors, Dirk VanderWal and Fergus Kyne, and do not necessarily represent the views or opinions of Newport Realty Ltd. or the Victoria Real Estate Board. Not intended to solicit parties already under contract. E&OE.
Terms
For a list of terms and definitions used in The Q Report, click here.
Data Analysis
The Q Report’s analysis includes listing and sales data exclusively from the Victoria Real Estate Board’s Multiple Listing Service® (MLS®) ‘Core’, ‘Westshore’, and ‘Peninsula’ regions. Data is analyzed for unconditional pending and completed sales that occurred between 2025/10/01 and 2025/12/31 except where specifically noted otherwise.
Data Sources
Bank of Canada
BC Real Estate Association
Canadian Real Estate Association
Victoria Real Estate Board