

INTRODUCTION
Welcome, Q Report readers, to our analysis of the Victoria real estate market for the third quarter of 2026. Summer followed its usual script — sales eased back from the spring peak, properties took a little more time to sell, and inventory pulled back from its Q2 high. But beneath those familiar seasonal patterns, the defining theme of the quarter was a market moving at two speeds, where detached and luxury homes held their ground on price, while the strata segment showed its clearest signs of softening in years.
Q3 also unfolded against a noisier backdrop than usual. The Bank of Canada held its policy rate at 2.25% through the summer, while late August brought a breakdown in Canada-U.S. trade talks and a fresh round of tariffs. Victoria has a long track record of taking outside headwinds in stride, and Q3 was no exception — but buyers are clearly taking their time, and the data rewards sellers who meet the market where it is.
MARKET BREAKDOWN
Overview
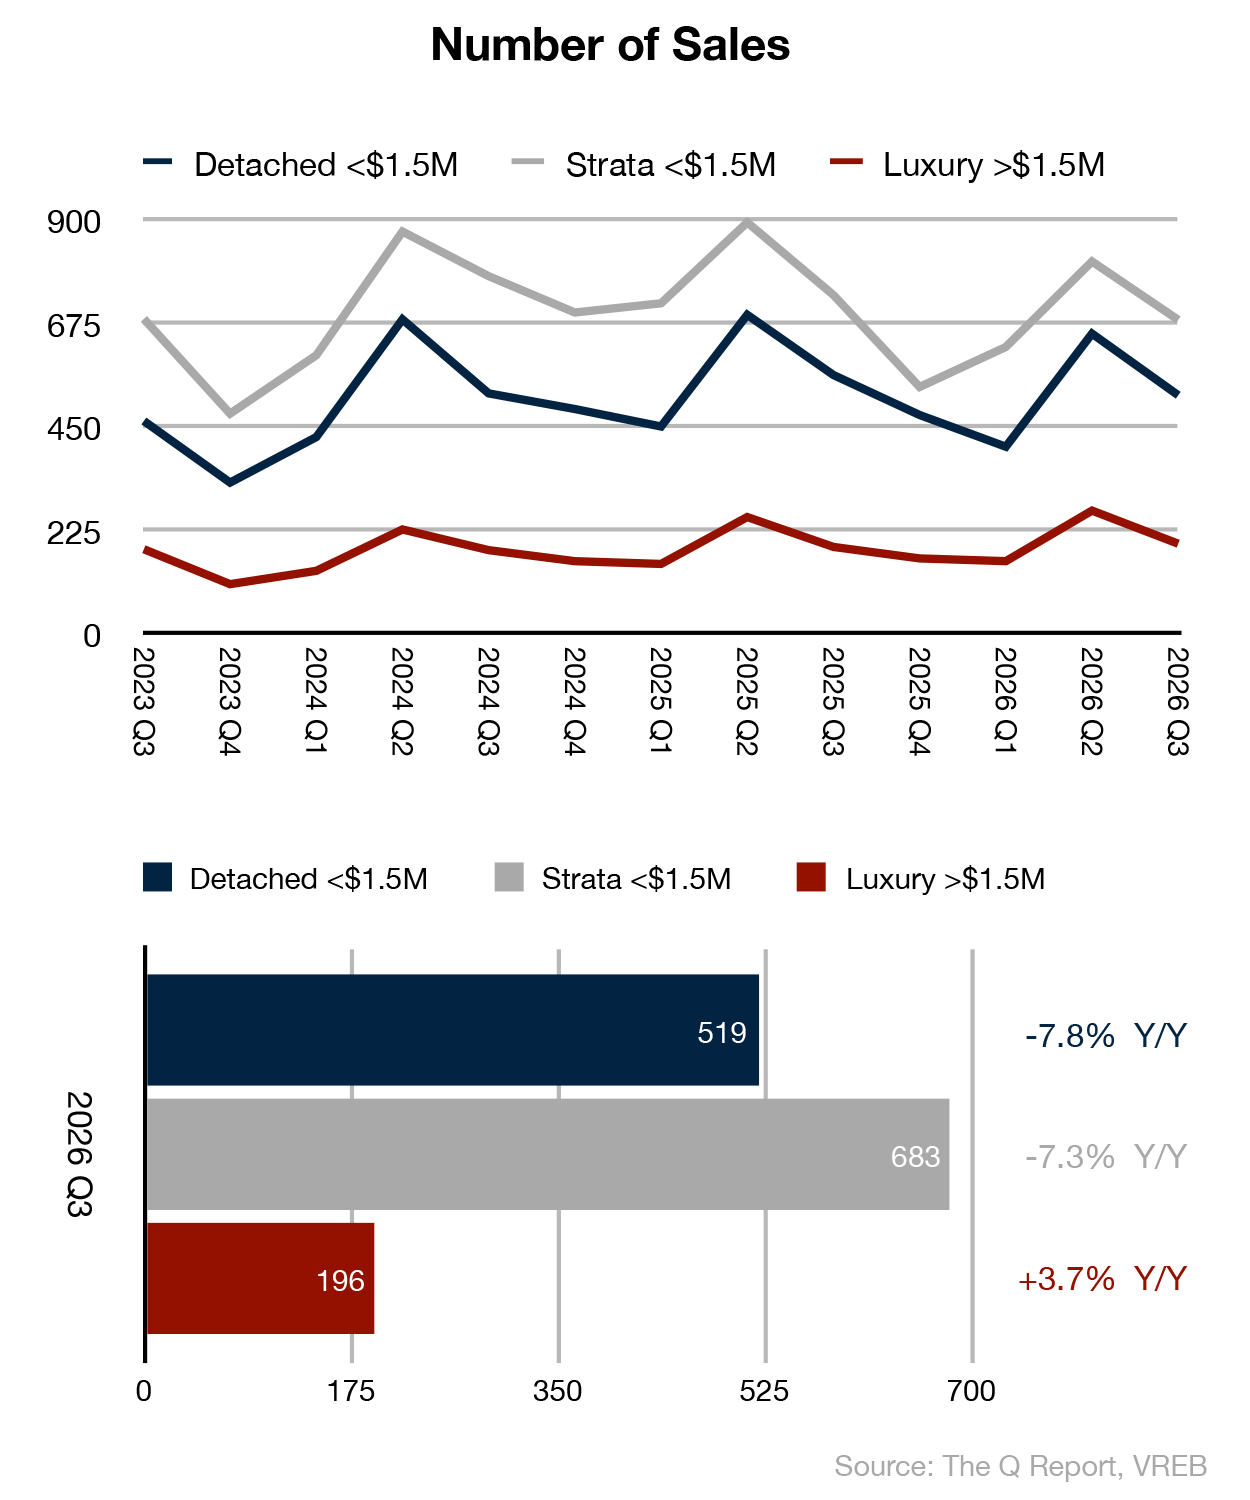
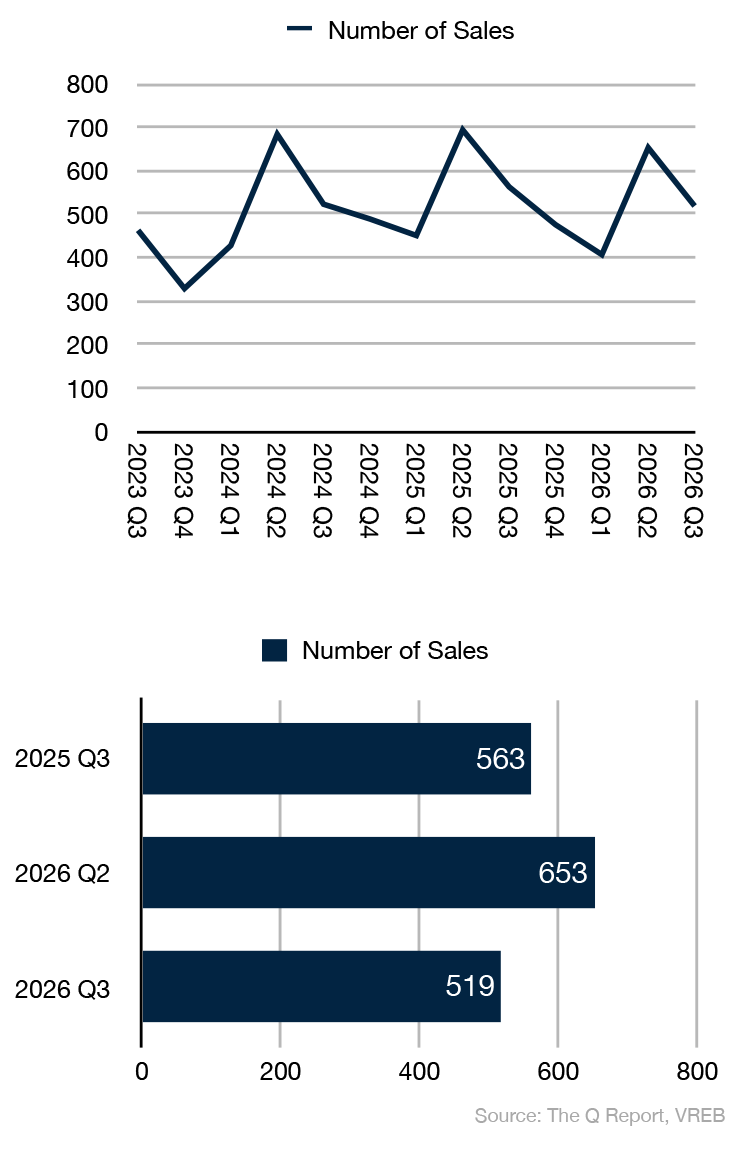
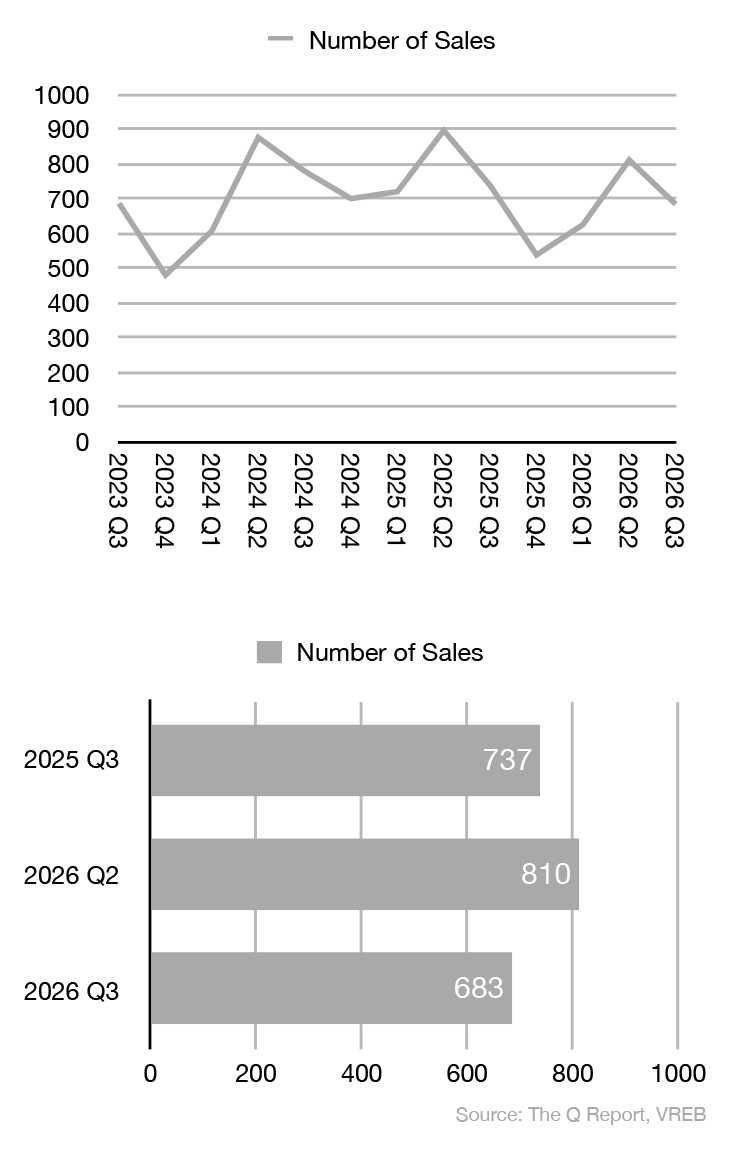
- A Normal Summer Slowdown: As expected for the season, we saw sales down across every segment compared to spring — Detached by -20.5%, Strata by -15.7%, and Luxury by -26.9% — in line with the typical Q2-to-Q3 dip we see every year. Year-over-year, Detached sales were down -7.8% and Strata -7.3%.
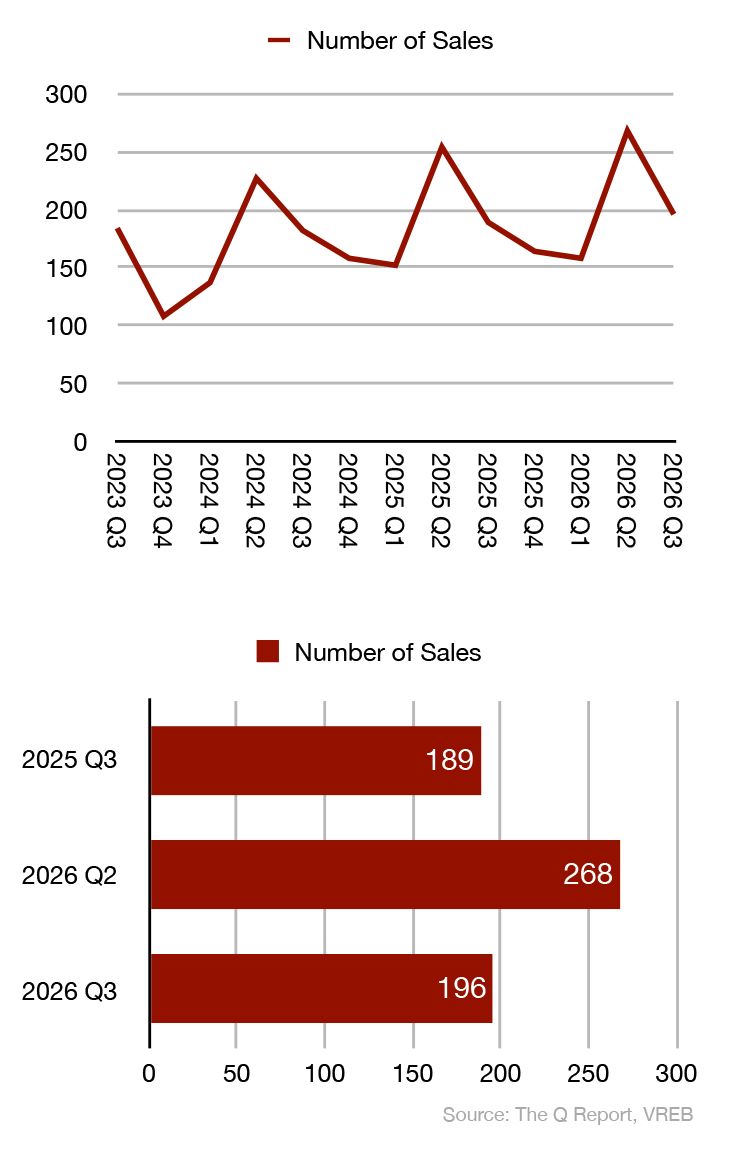
- Luxury Keeps Its Streak Alive: The Luxury segment was once again the only one to grow sales year-over-year, up +3.7% to 196, making eight straight quarters of Y/Y sales growth for homes over $1.5M.
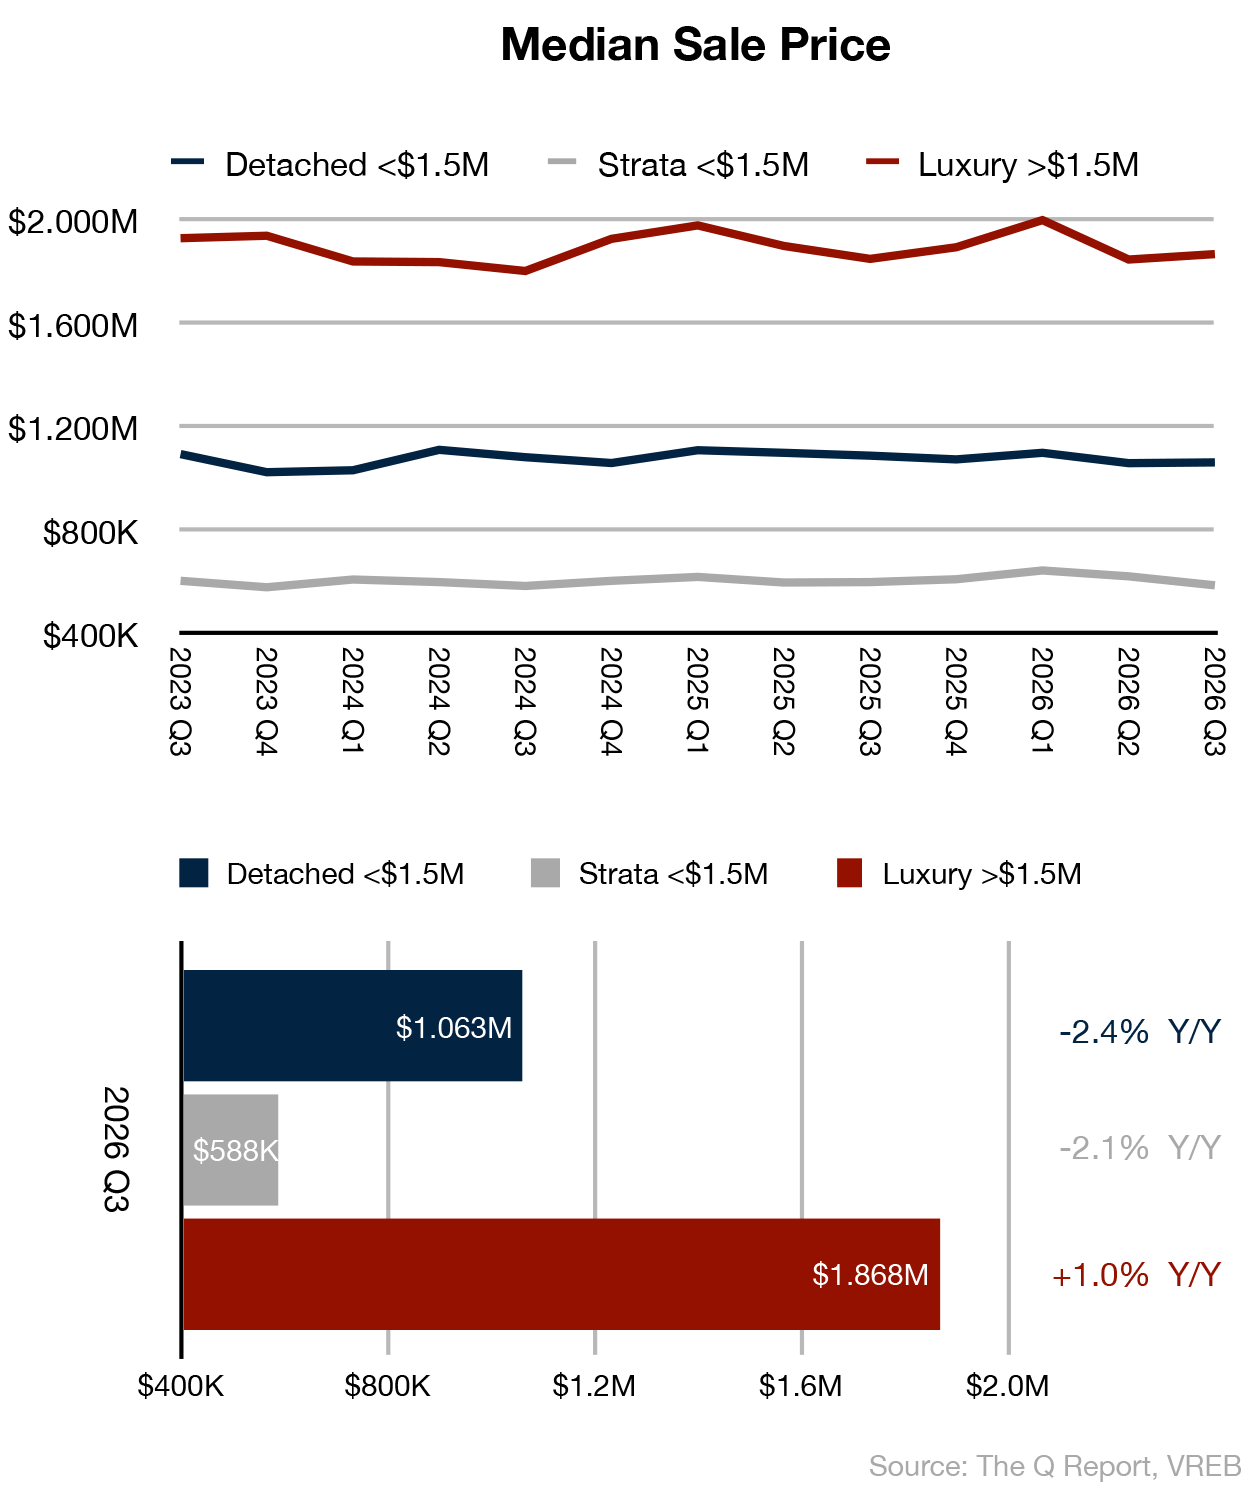
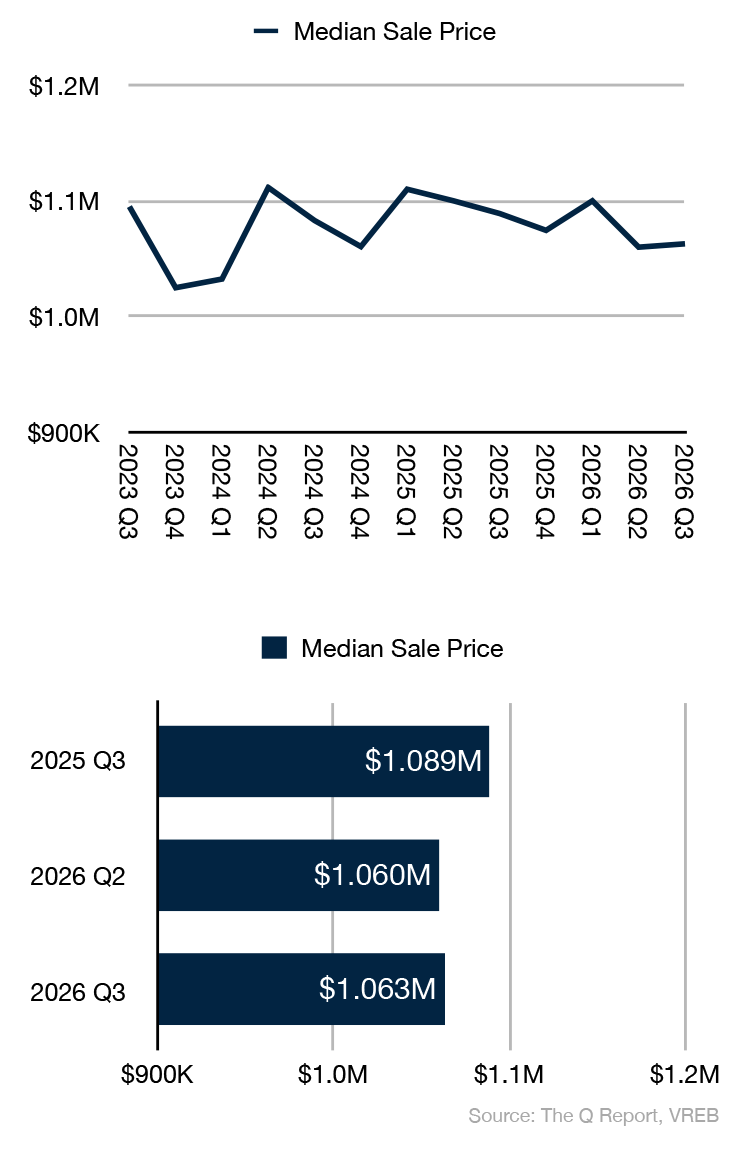
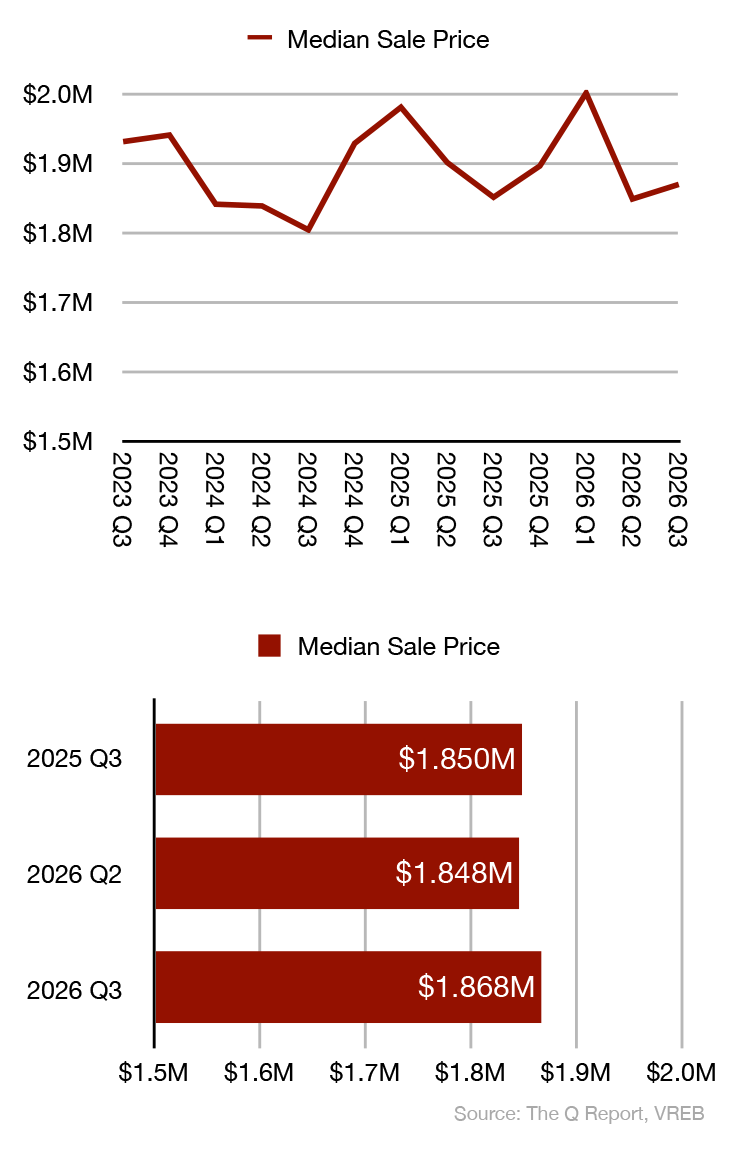
- Detached and Luxury Prices Hold Steady: The Detached median sale price was essentially flat from Q2 at $1,062,900 (+0.3% Q/Q, -2.4% Y/Y), while the Luxury median edged up 1% to $1,868,500.
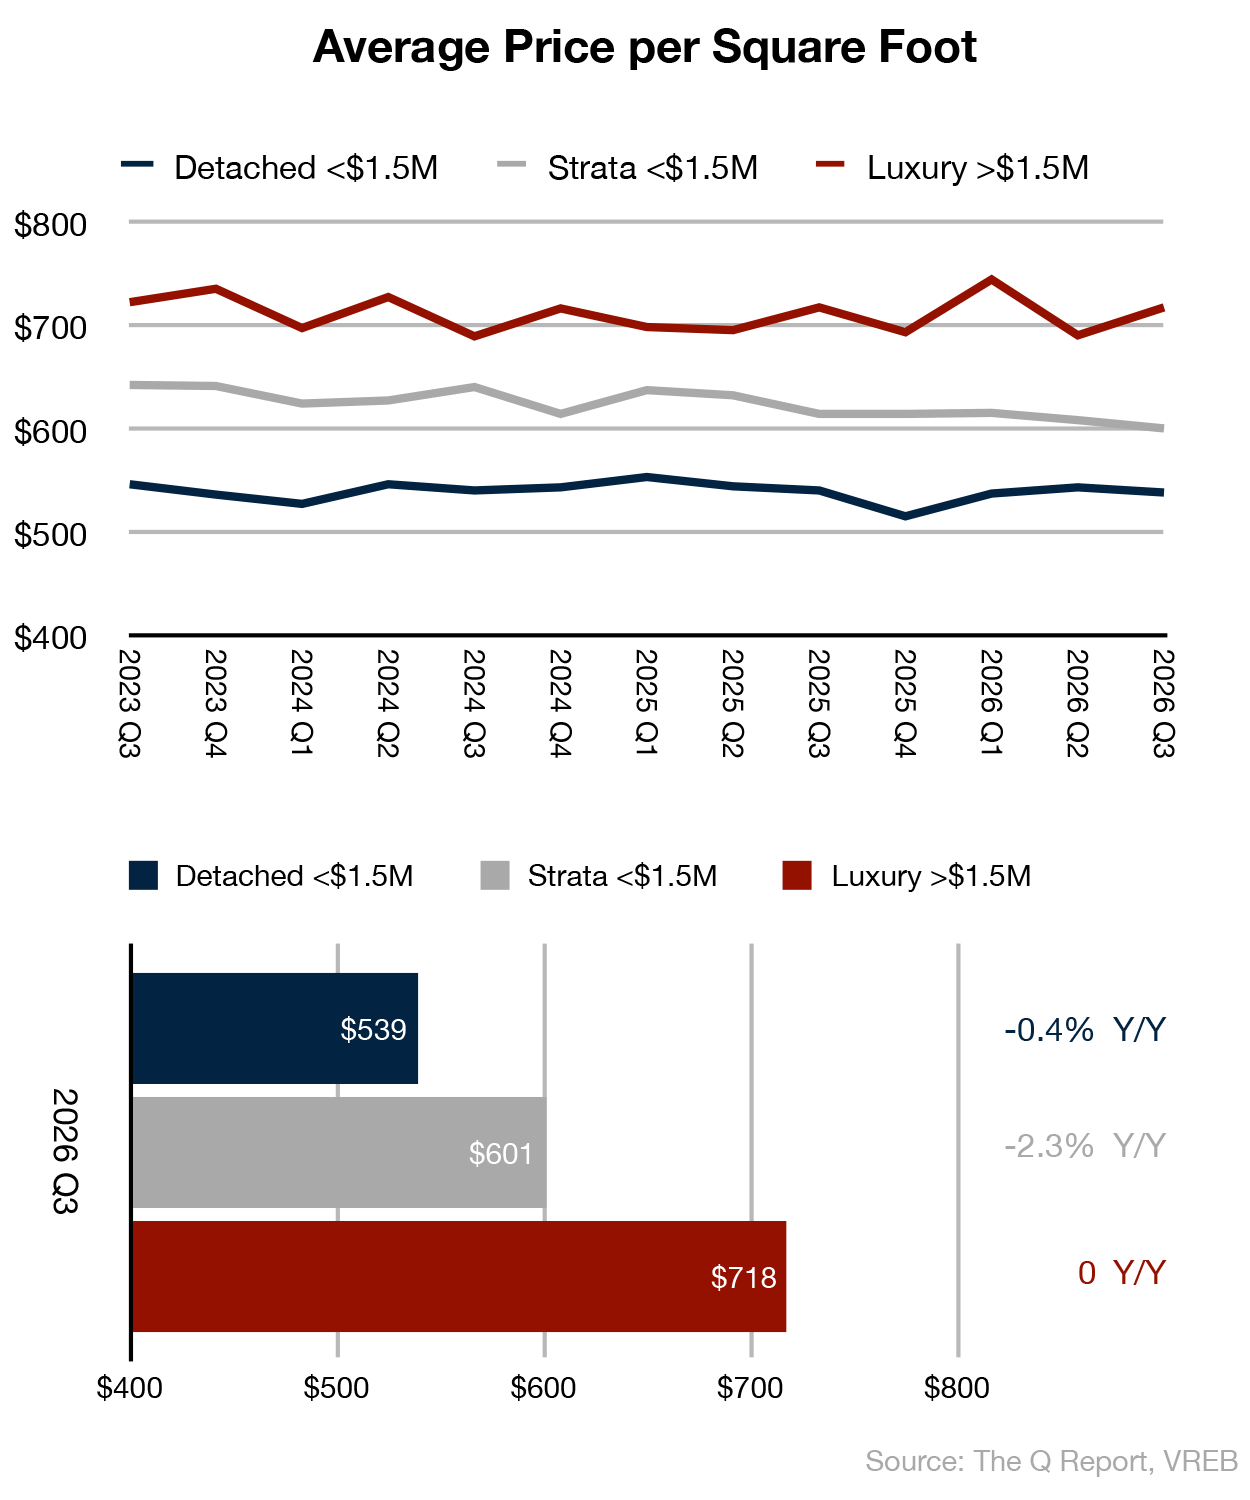
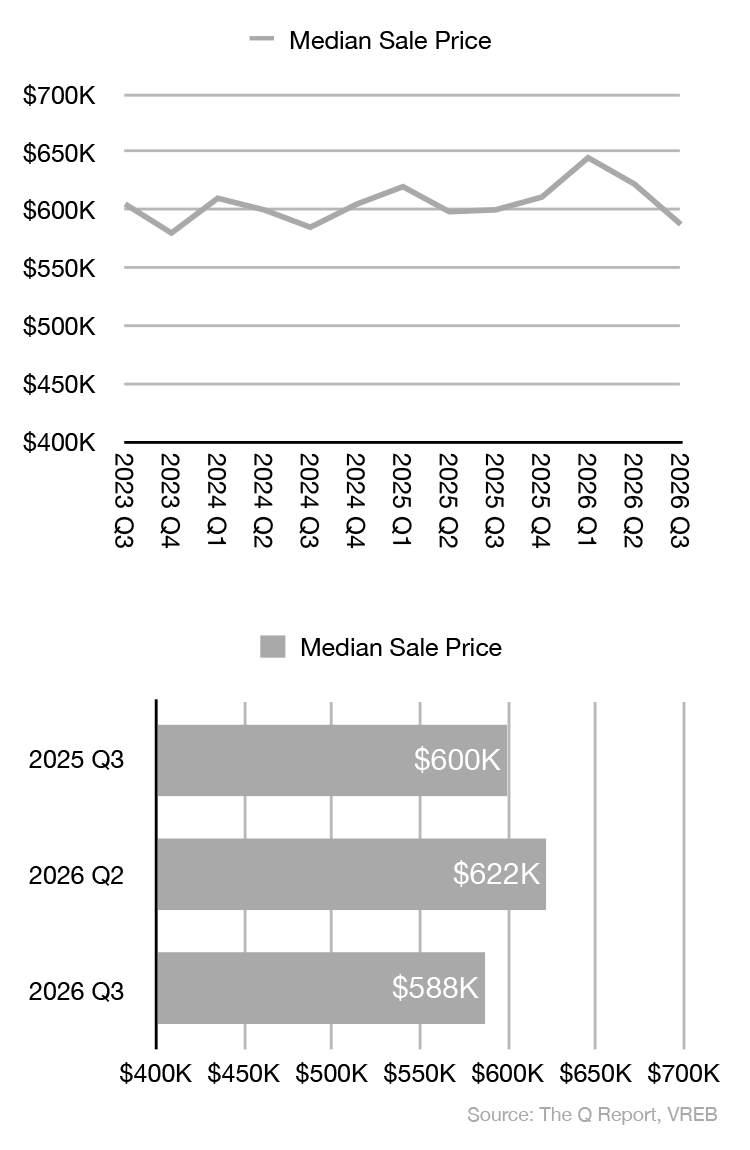
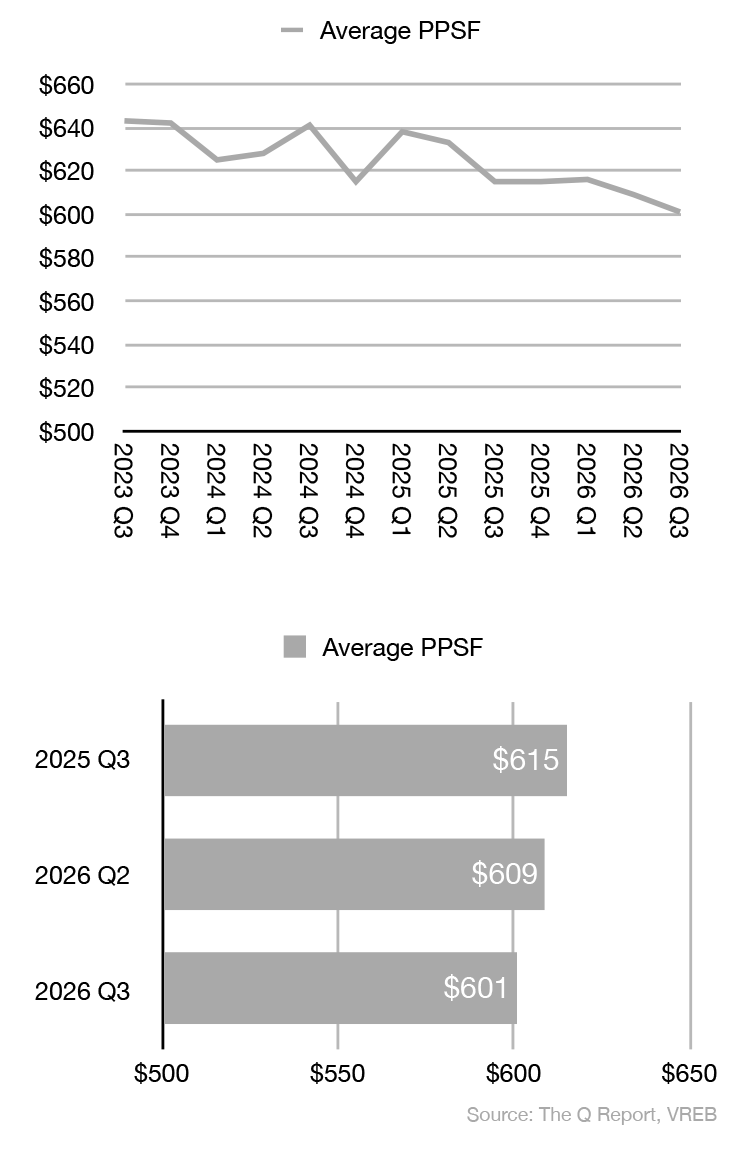
- Strata Softens: The Strata median sale price dropped to $587,500 (-5.6% Q/Q, -2.1% Y/Y) — its lowest level since Q4 2023 — and price per square foot (PPSF) slipped to $601, the lowest reading in several years.
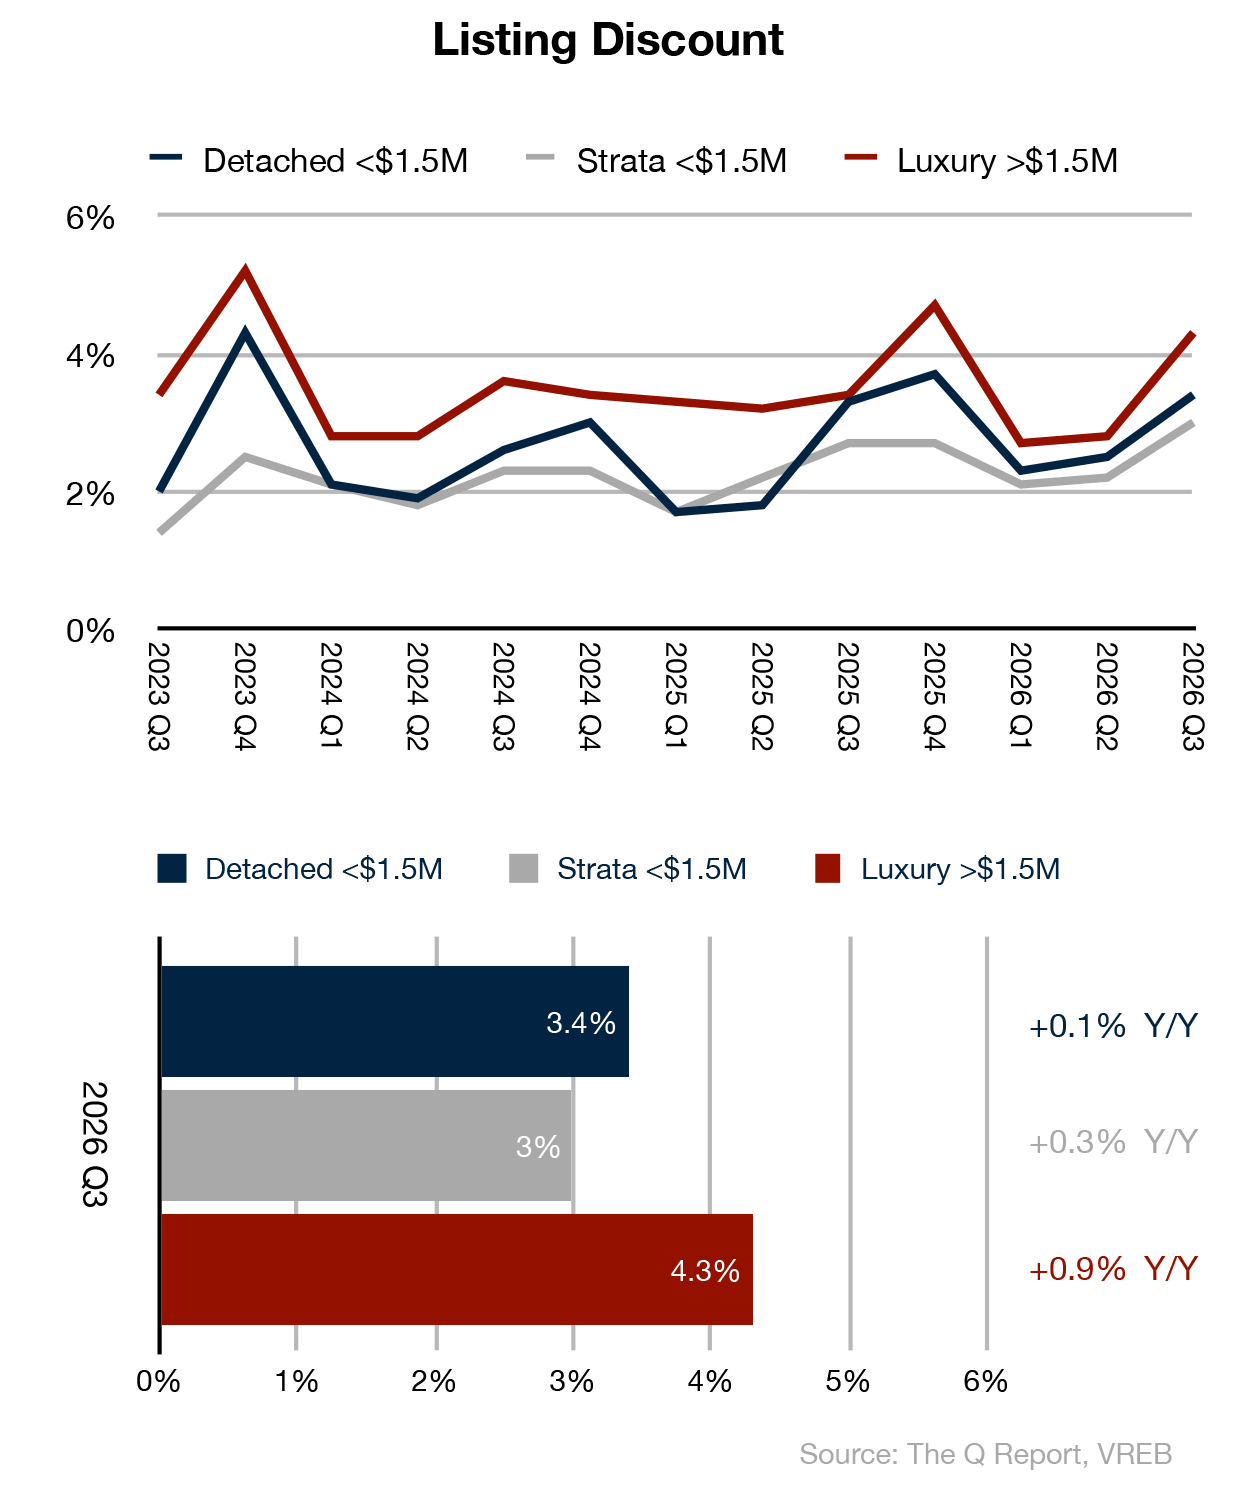
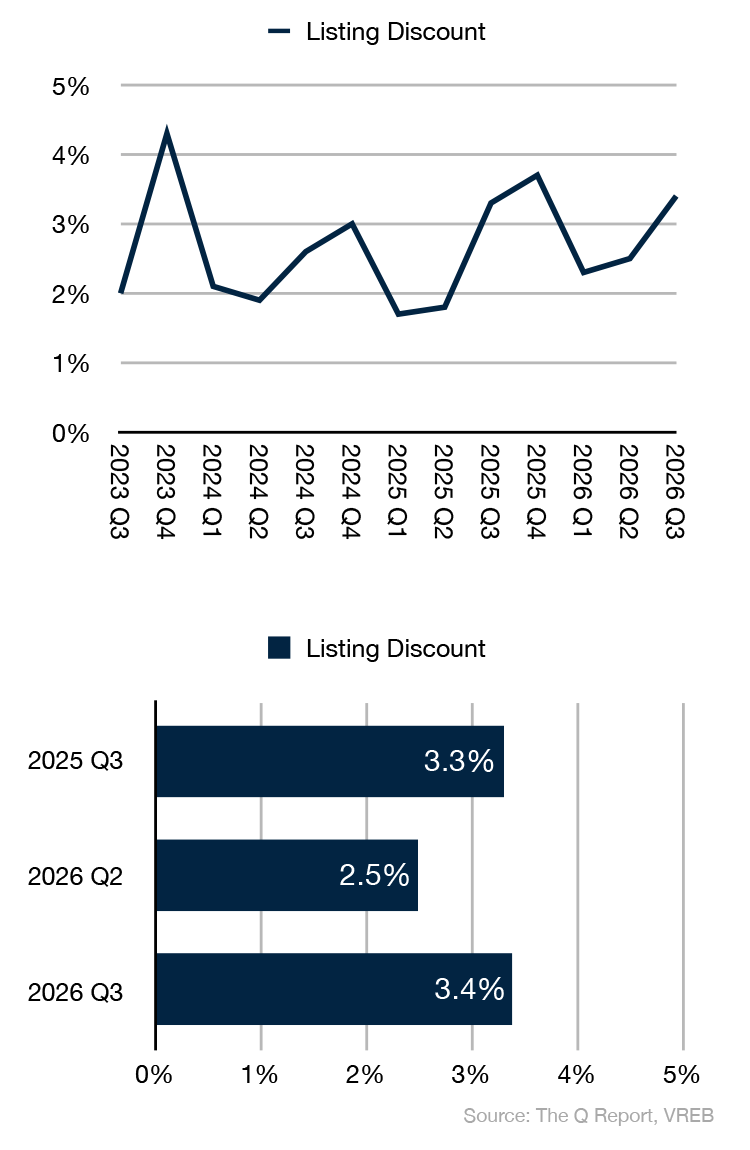
- Listing Discounts Widen Again: After tightening through the first half of the year, listing discounts widened in every segment: Detached to 3.4%, Strata to 3.0%, and Luxury to 4.3%. Buyers are negotiating harder, and sellers are giving up a little more ground to get to a deal, as some face the reality that pricing has shifted since the market’s post-pandemic boom.
THE BIG PICTURE: Same Season, Different Speeds
The summer real estate market is almost always shaped by the calendar — families settle in before the school year, vacations take buyers out of the market, and the spring listing wave slowly works its way through. This year, the seasonal story was overlaid with a broader one: a market clearly separating by segment.
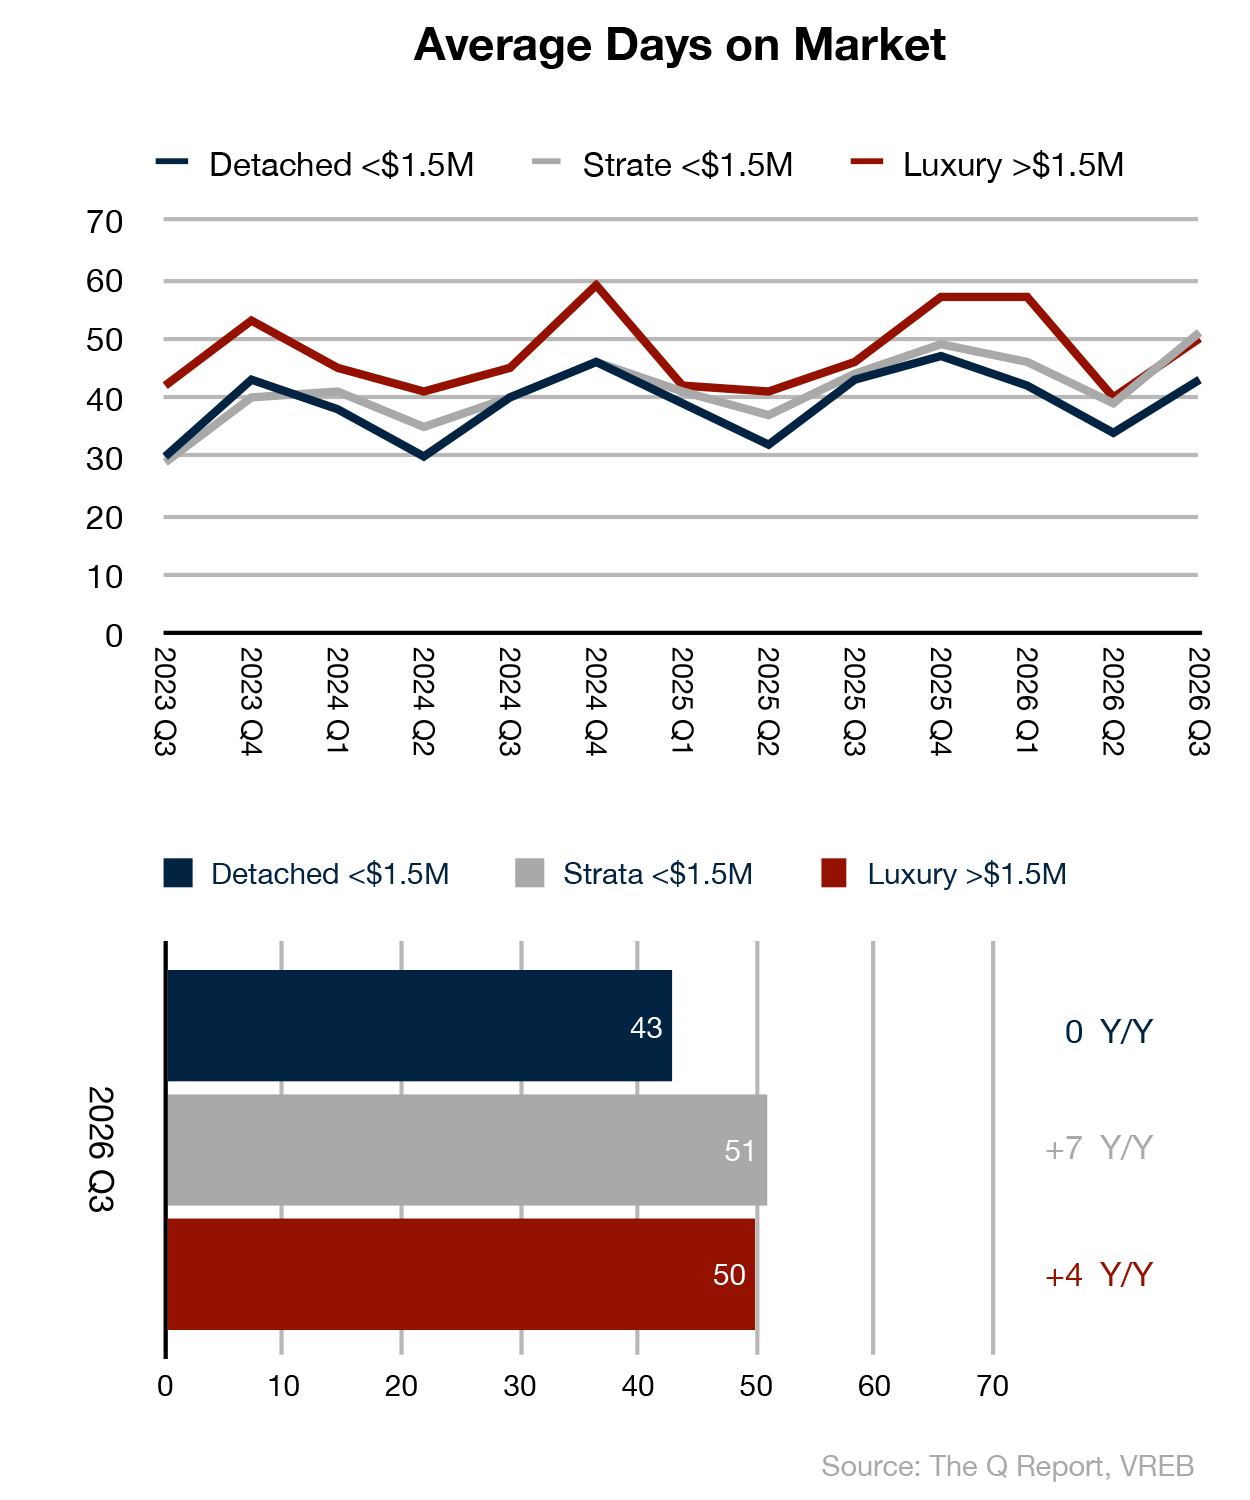
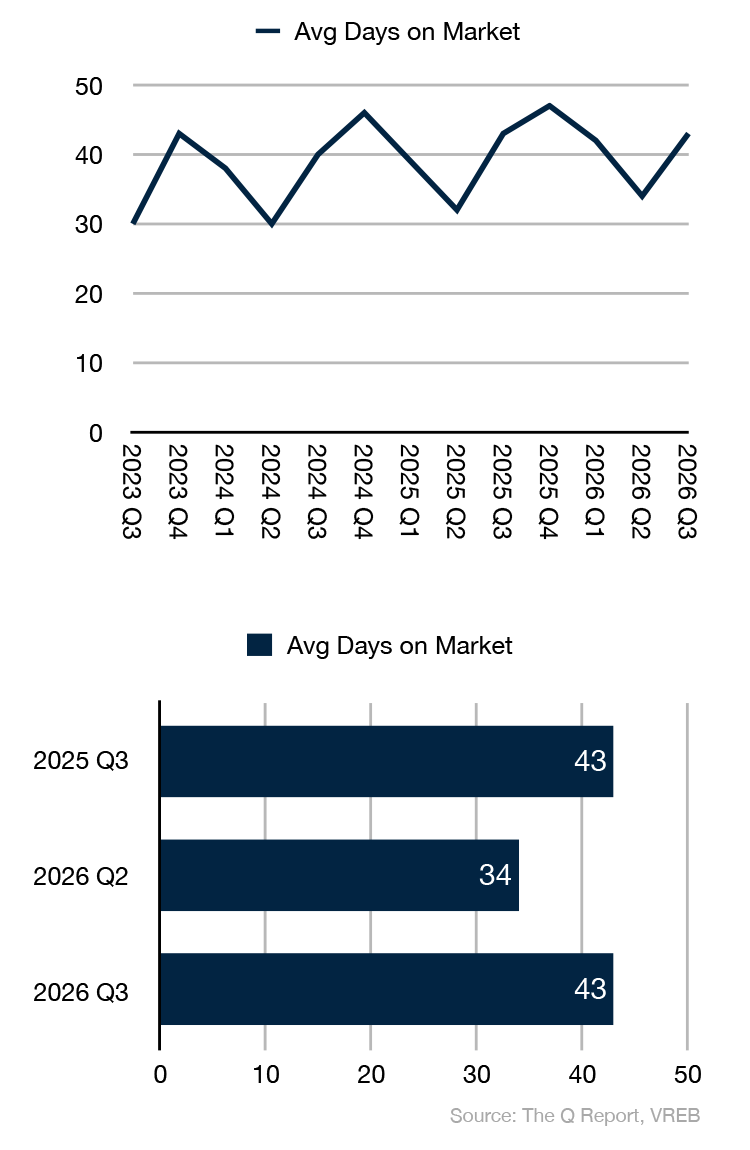
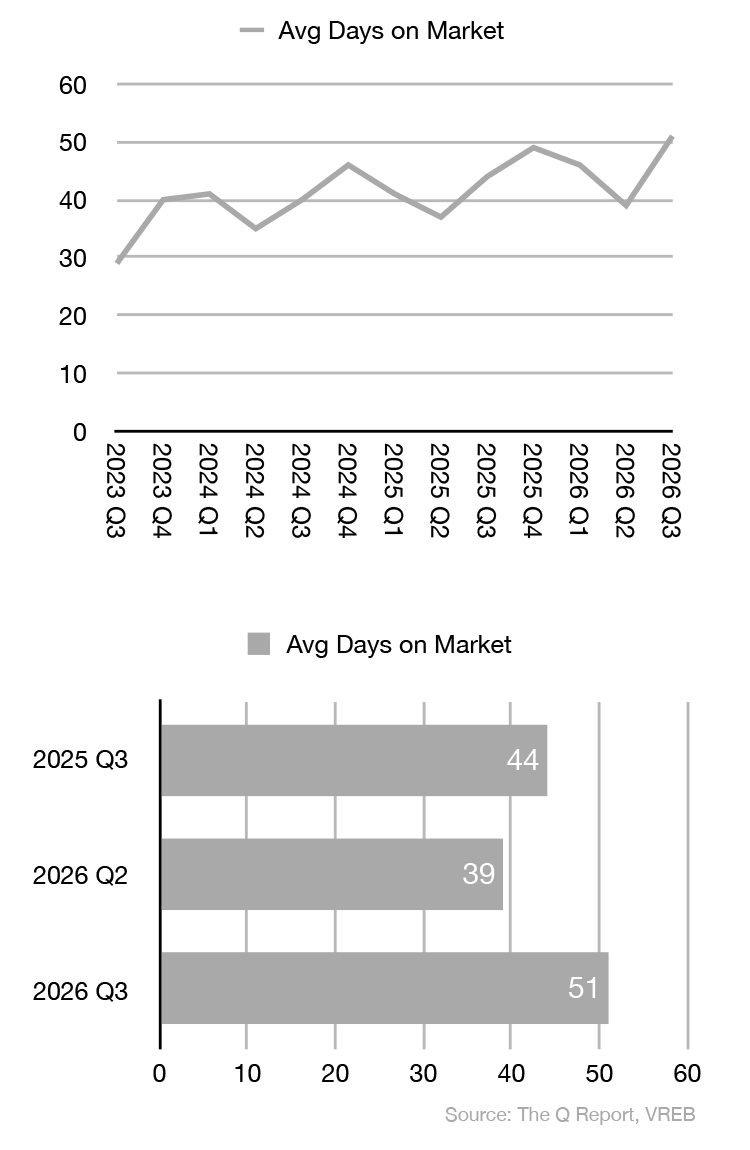
- Days on Market Lengthen: Homes took longer to sell across the board. Detached properties averaged 43 days (up 9 from Q2, flat year-over-year), Luxury averaged 50 days (up 10 from Q2 and 4 from Q3 2025), and Strata averaged 51 days (up 12 from Q2 and 7 from last year) — the longest average strata timeline in our tracked data.
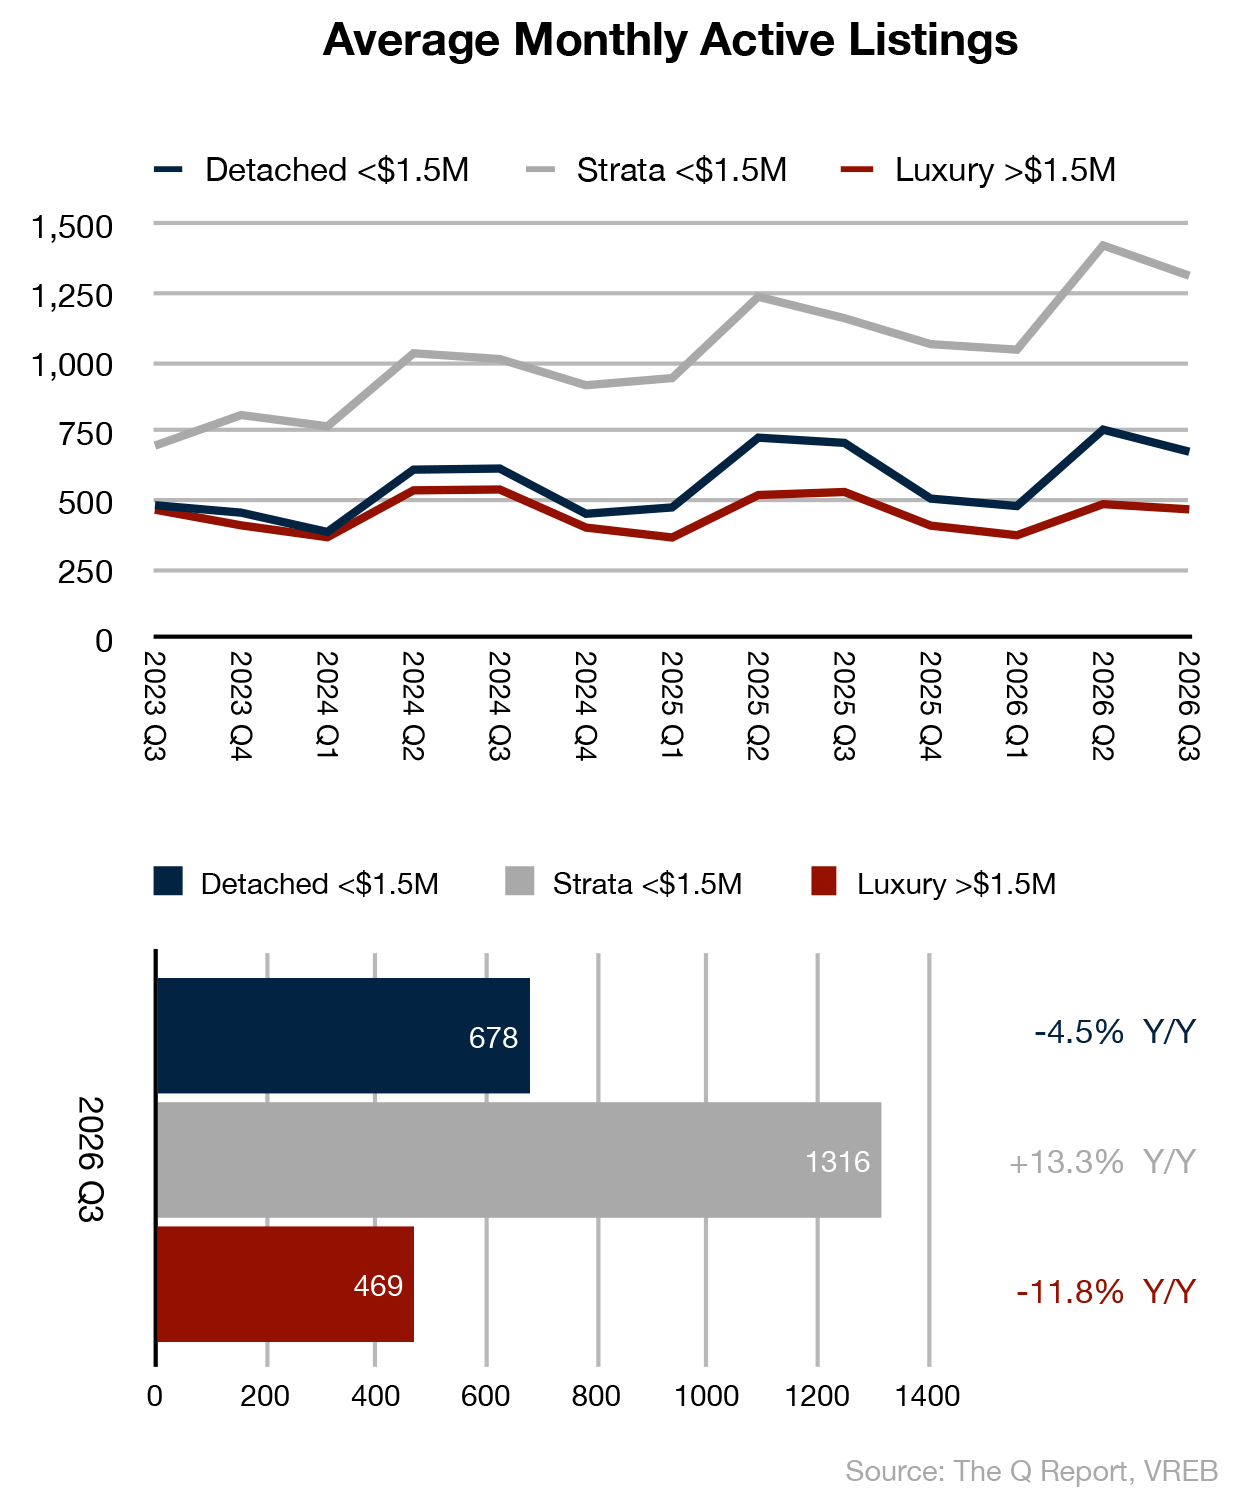
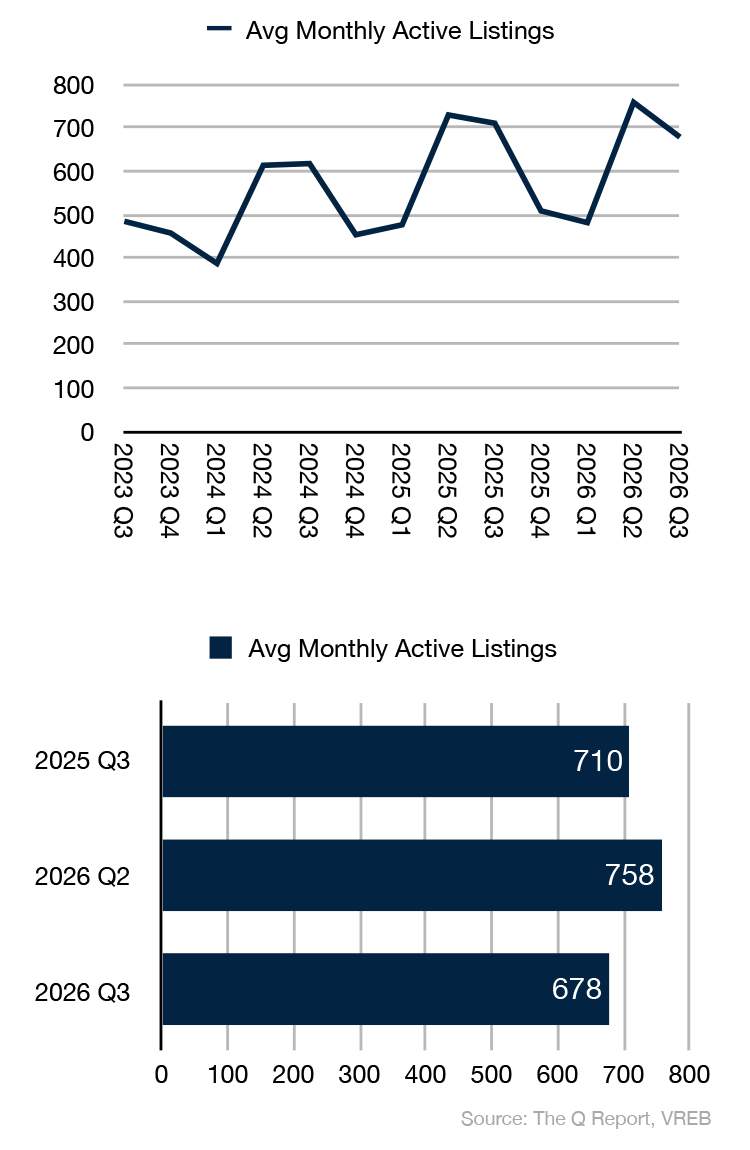
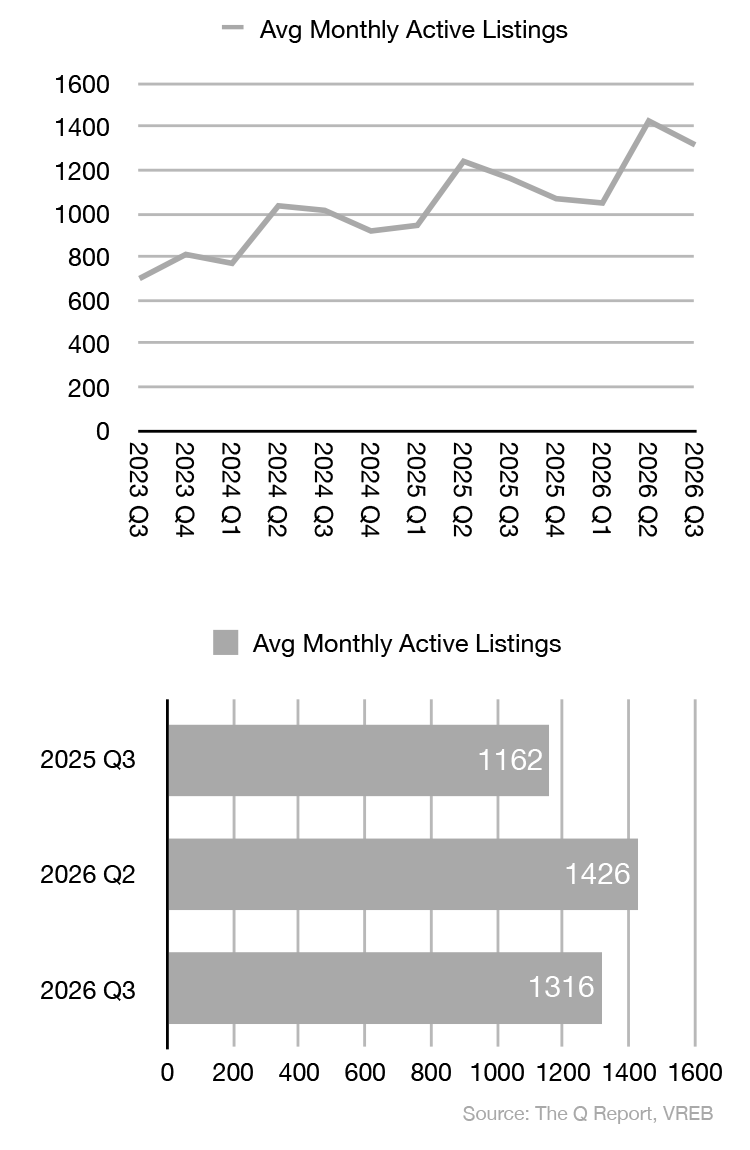
- Inventory Tells Two Stories: Detached inventory averaged 678 monthly active listings (-4.5% Y/Y) and Luxury 469 (-11.8% Y/Y) — both tighter than a year ago. Strata went the other way: 1,316 average active listings, up +13.3% year-over-year. More choice and less competition = pressure on strata prices.
- Rates on Hold, Confidence on Watch: The Bank of Canada held its policy rate at 2.25% in both July and September — its seventh consecutive hold since the last cut in October 2025 — keeping prime at 4.45%. Borrowing costs were steady all quarter, so the slower pace we saw is less about rates and more about confidence. In late August, Canada-U.S. trade talks collapsed, the U.S. imposed 50% tariffs on a range of Canadian goods, and Canada answered with counter-tariffs effective September 8. That kind of headline gives buyers a reason to pause on big decisions, and it showed up most in the price-sensitive entry level.
Detached Homes, <$1.5M
The Detached Market: Steady as She Goes
If one were looking for drama in the detached market this summer, they would not have found much — which we consider a good thing. Prices held stable, inventory was tighter than last year, and the seasonal slowdown landed right where expectation said it should.
- Sales Activity: 519 detached homes sold in Q3 2026, down -20.5% from last quarter and -7.8% from a year ago. The quarterly dip is typical — we’ve seen Q2-to-Q3 declines of roughly ~20-25% in each of the past three years.
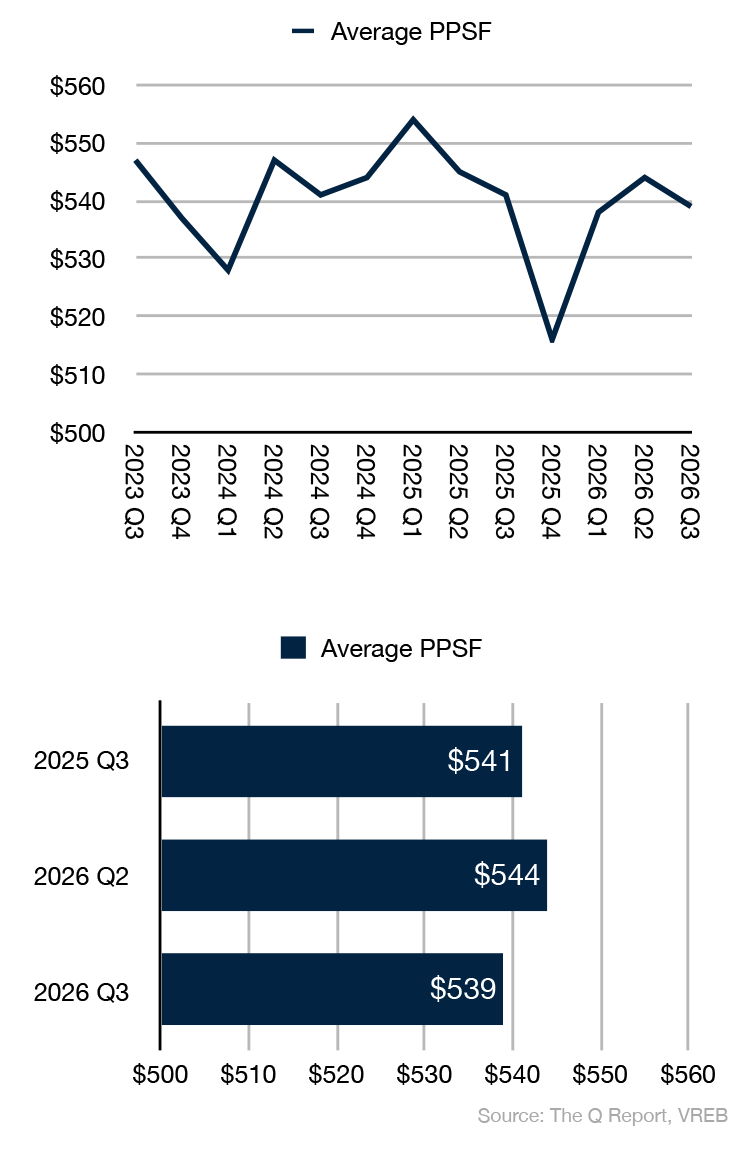
- Price Performance: Median sale price was essentially unchanged from Q2 and down -2.4% from a year ago. PPSF came in at $539, within less than 1% Q/Q and Y/Y. This remains a segment holding its value with true consistency.
- Listing Discount: The discount on sale prices compared to asking widened to 3.4% from 2.5% in Q2, almost exactly matching the 3.3% discount we saw a year ago. Hence, we see a seasonal pattern rather than a warning sign — late-summer buyers tend to negotiate a little harder, as they did again this year.
- Inventory and Days on Market: Average monthly active listings of 678 were down -10.6% from Q2’s 758 and -4.5% below Q3 2025’s 710. Homes averaged 43 DOM, identical to a year ago. Steady supply, steady timelines, and steady prices all indicated that balanced conditions prevailed in the detached market.
Strata Homes, <$1.5M
The Strata Market: A Buyer’s Window Opens Wider
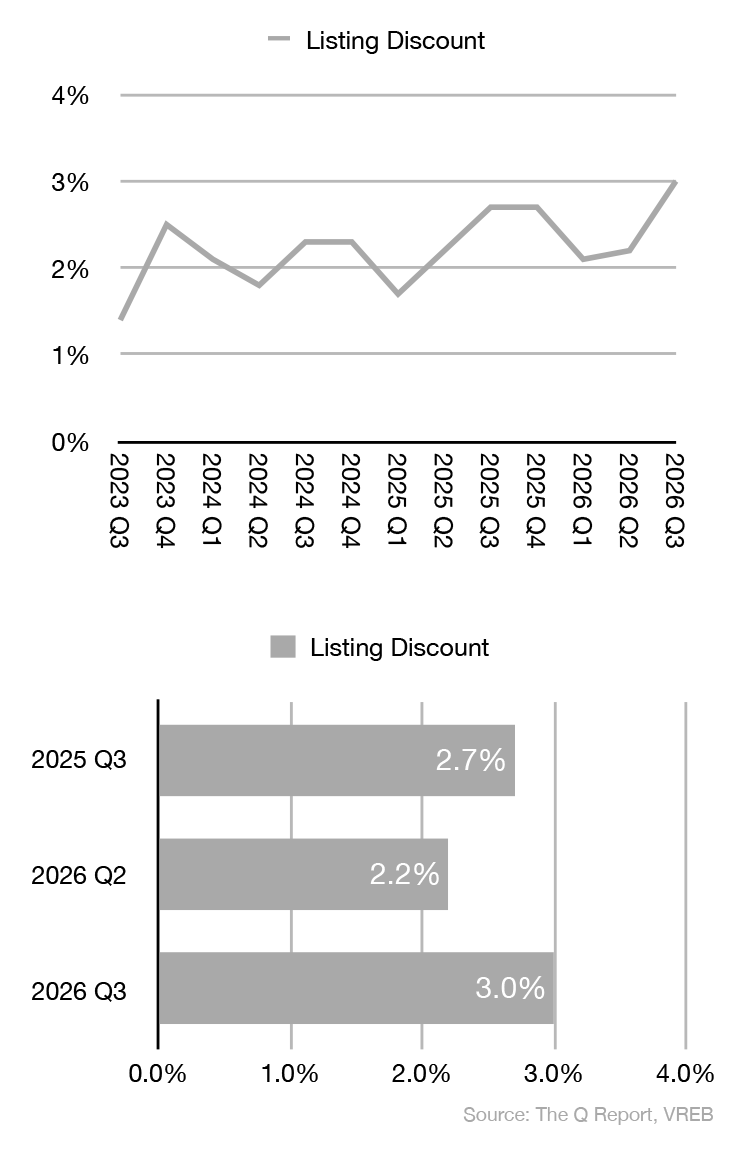
The strata segment is where Q3’s story gets much more interesting. Nearly every measure — sale prices, PPSF, DOM, and listing discount — moved in the buyer’s favour, while inventory remained well above both last year’s levels and historical averages.
- Sales Volume: 683 sales in Q3 2026 were down -15.7% from Q2’s 810 and -7.3% from Q3 2025’s 737. Year-to-date, strata sales are running about 10% behind 2025, the softest of our three segments.
- Price Performance: The median sale price fell to $587,500, down -5.6% from spring and -2.1% from a year ago, making for the lowest median strata sale price we’ve seen since the end of 2023. PPSF of $601 was down -1.3% from Q2 and -2.3% Y/Y, marking the lowest PPSF in the a number of years. Remembering that Q1’s median sale price of $645,000 was the high-water mark, we see the strata segment has given back that gain and then some.
- Inventory Remains Elevated: Average monthly active listings eased -7.7% from Q2’s record high, but are still up +13.3% from a year ago. Strata buyers have more selection than at any time in recent memory outside of this past spring.
- Days on Market and Discount: Strata properties averaged 51 days on market — up by a third since spring, a week longer than a year ago, and the longest in recent memory. The listing discount widened to 3.0%, the widest spread since Q4 2022. For entry-level buyers and investors, this is the most negotiating room the strata market has offered in years.
Luxury Homes, >$1.5M
The Luxury Market (>$1.5M): Quietly Consistent
The luxury segment continues to march to its own beat. Sales grew year-over-year yet again, prices firmed, and inventory is tighter than it has been for a third quarter since 2023. The trade-off: buyers at these price points are taking their time and negotiating with confidence.
- Sales Volume: We counted 196 sales in Q3 2026, down -26.9% from an exceptionally strong Q2 (268 sales, the most in our tracked data) but up +3.7% Y/Y from Q3 2025. That is now eight consecutive quarters of year-over-year sales growth in this segment.
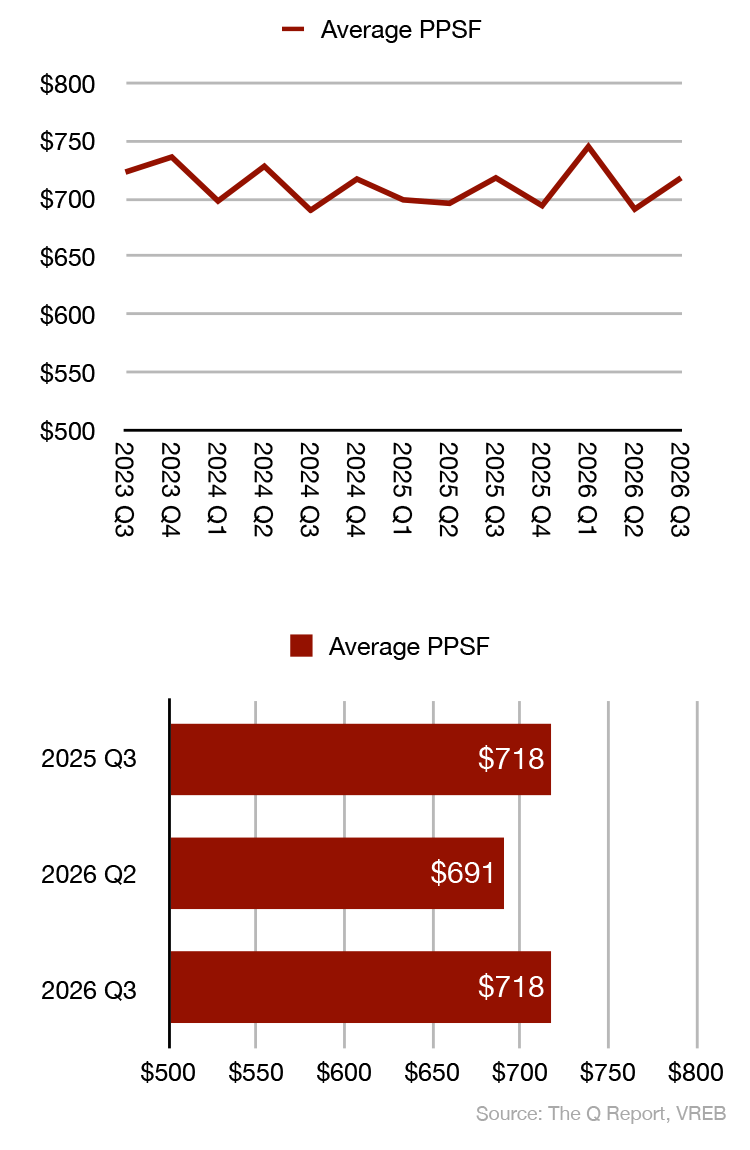
- Price Performance: The median sale price was up +1.1% from Q2 and +1.0% from Q3 2025. PPSF rebounded +3.9% from Q2’s slight dip to $718 — exactly where it stood a year ago.
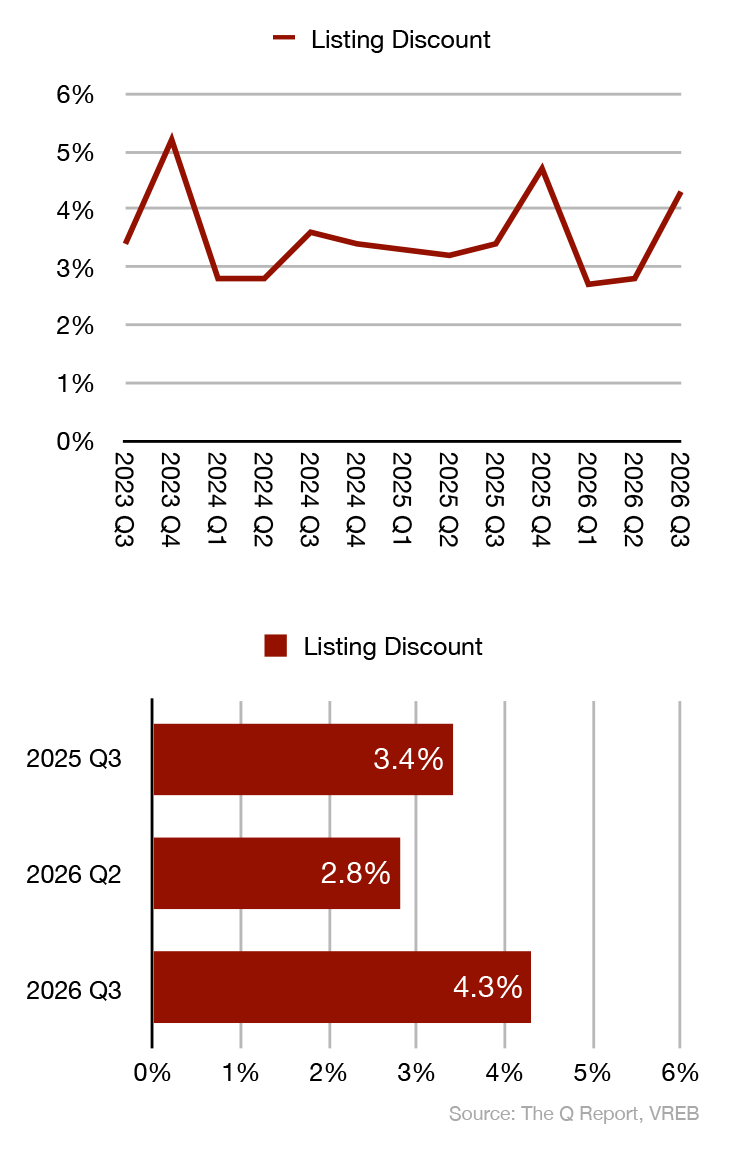
- Listing Discount Widens: The luxury discount increased to 4.3%, up from 2.8% in Q2 and 3.4% in Q3 2025 — the widest third-quarter discount in our tracked data. Well-priced luxury homes are selling; ambitiously priced ones are being negotiated down.
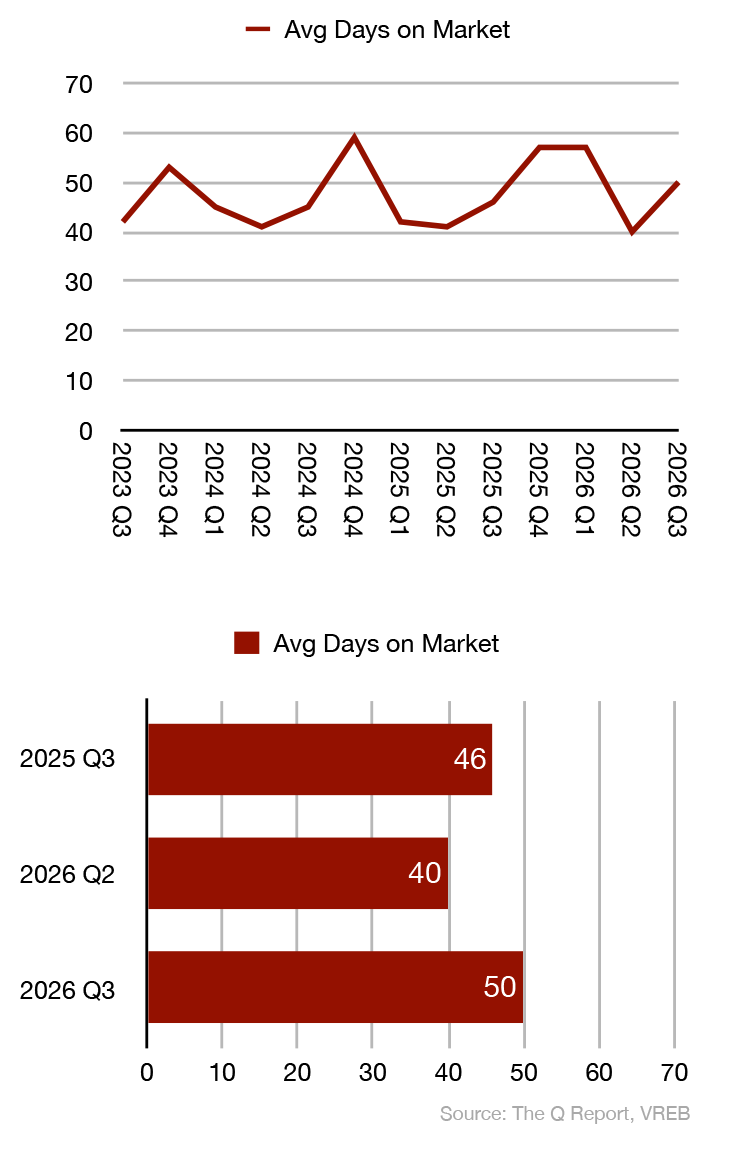
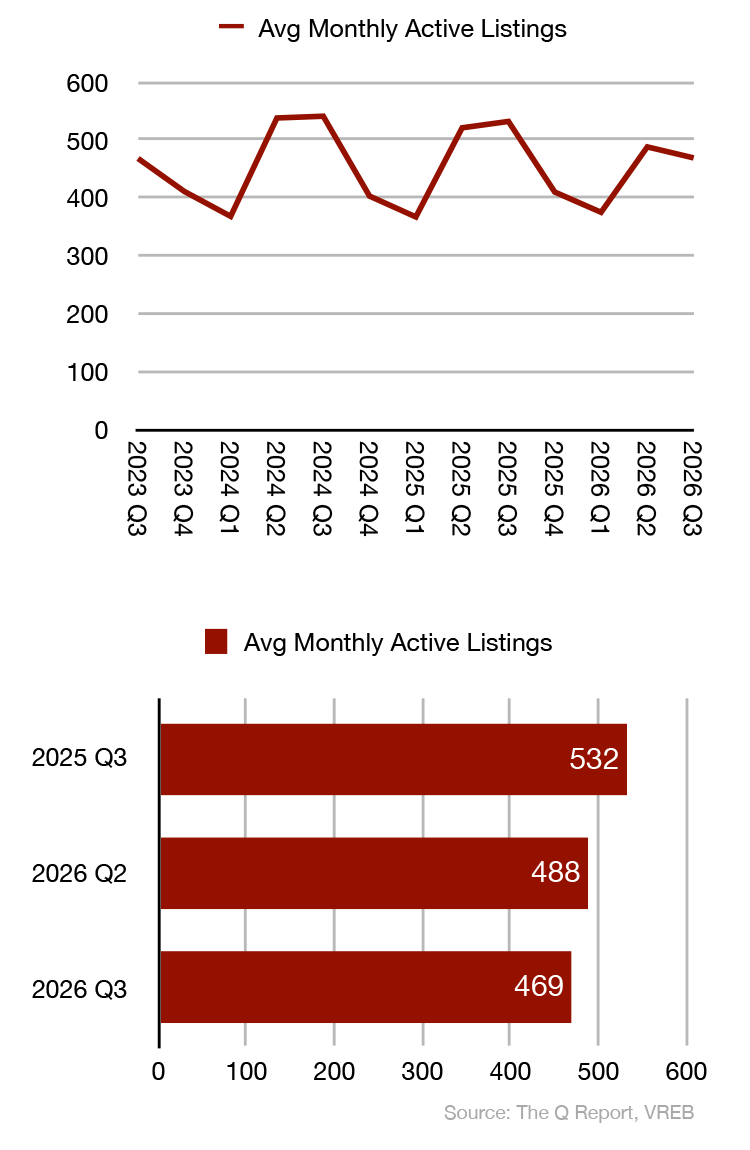
- Timelines and Inventory: Luxury homes averaged 50 DOM, up 10 days from Q2 and 4 from last year. Average monthly active listings of 469 were down -3.9% from Q2 and a notable -11.8% from Q3 2025’s 532. Tight supply continues to underpin luxury pricing even as buyers take a measured approach.
HPI® TRENDS
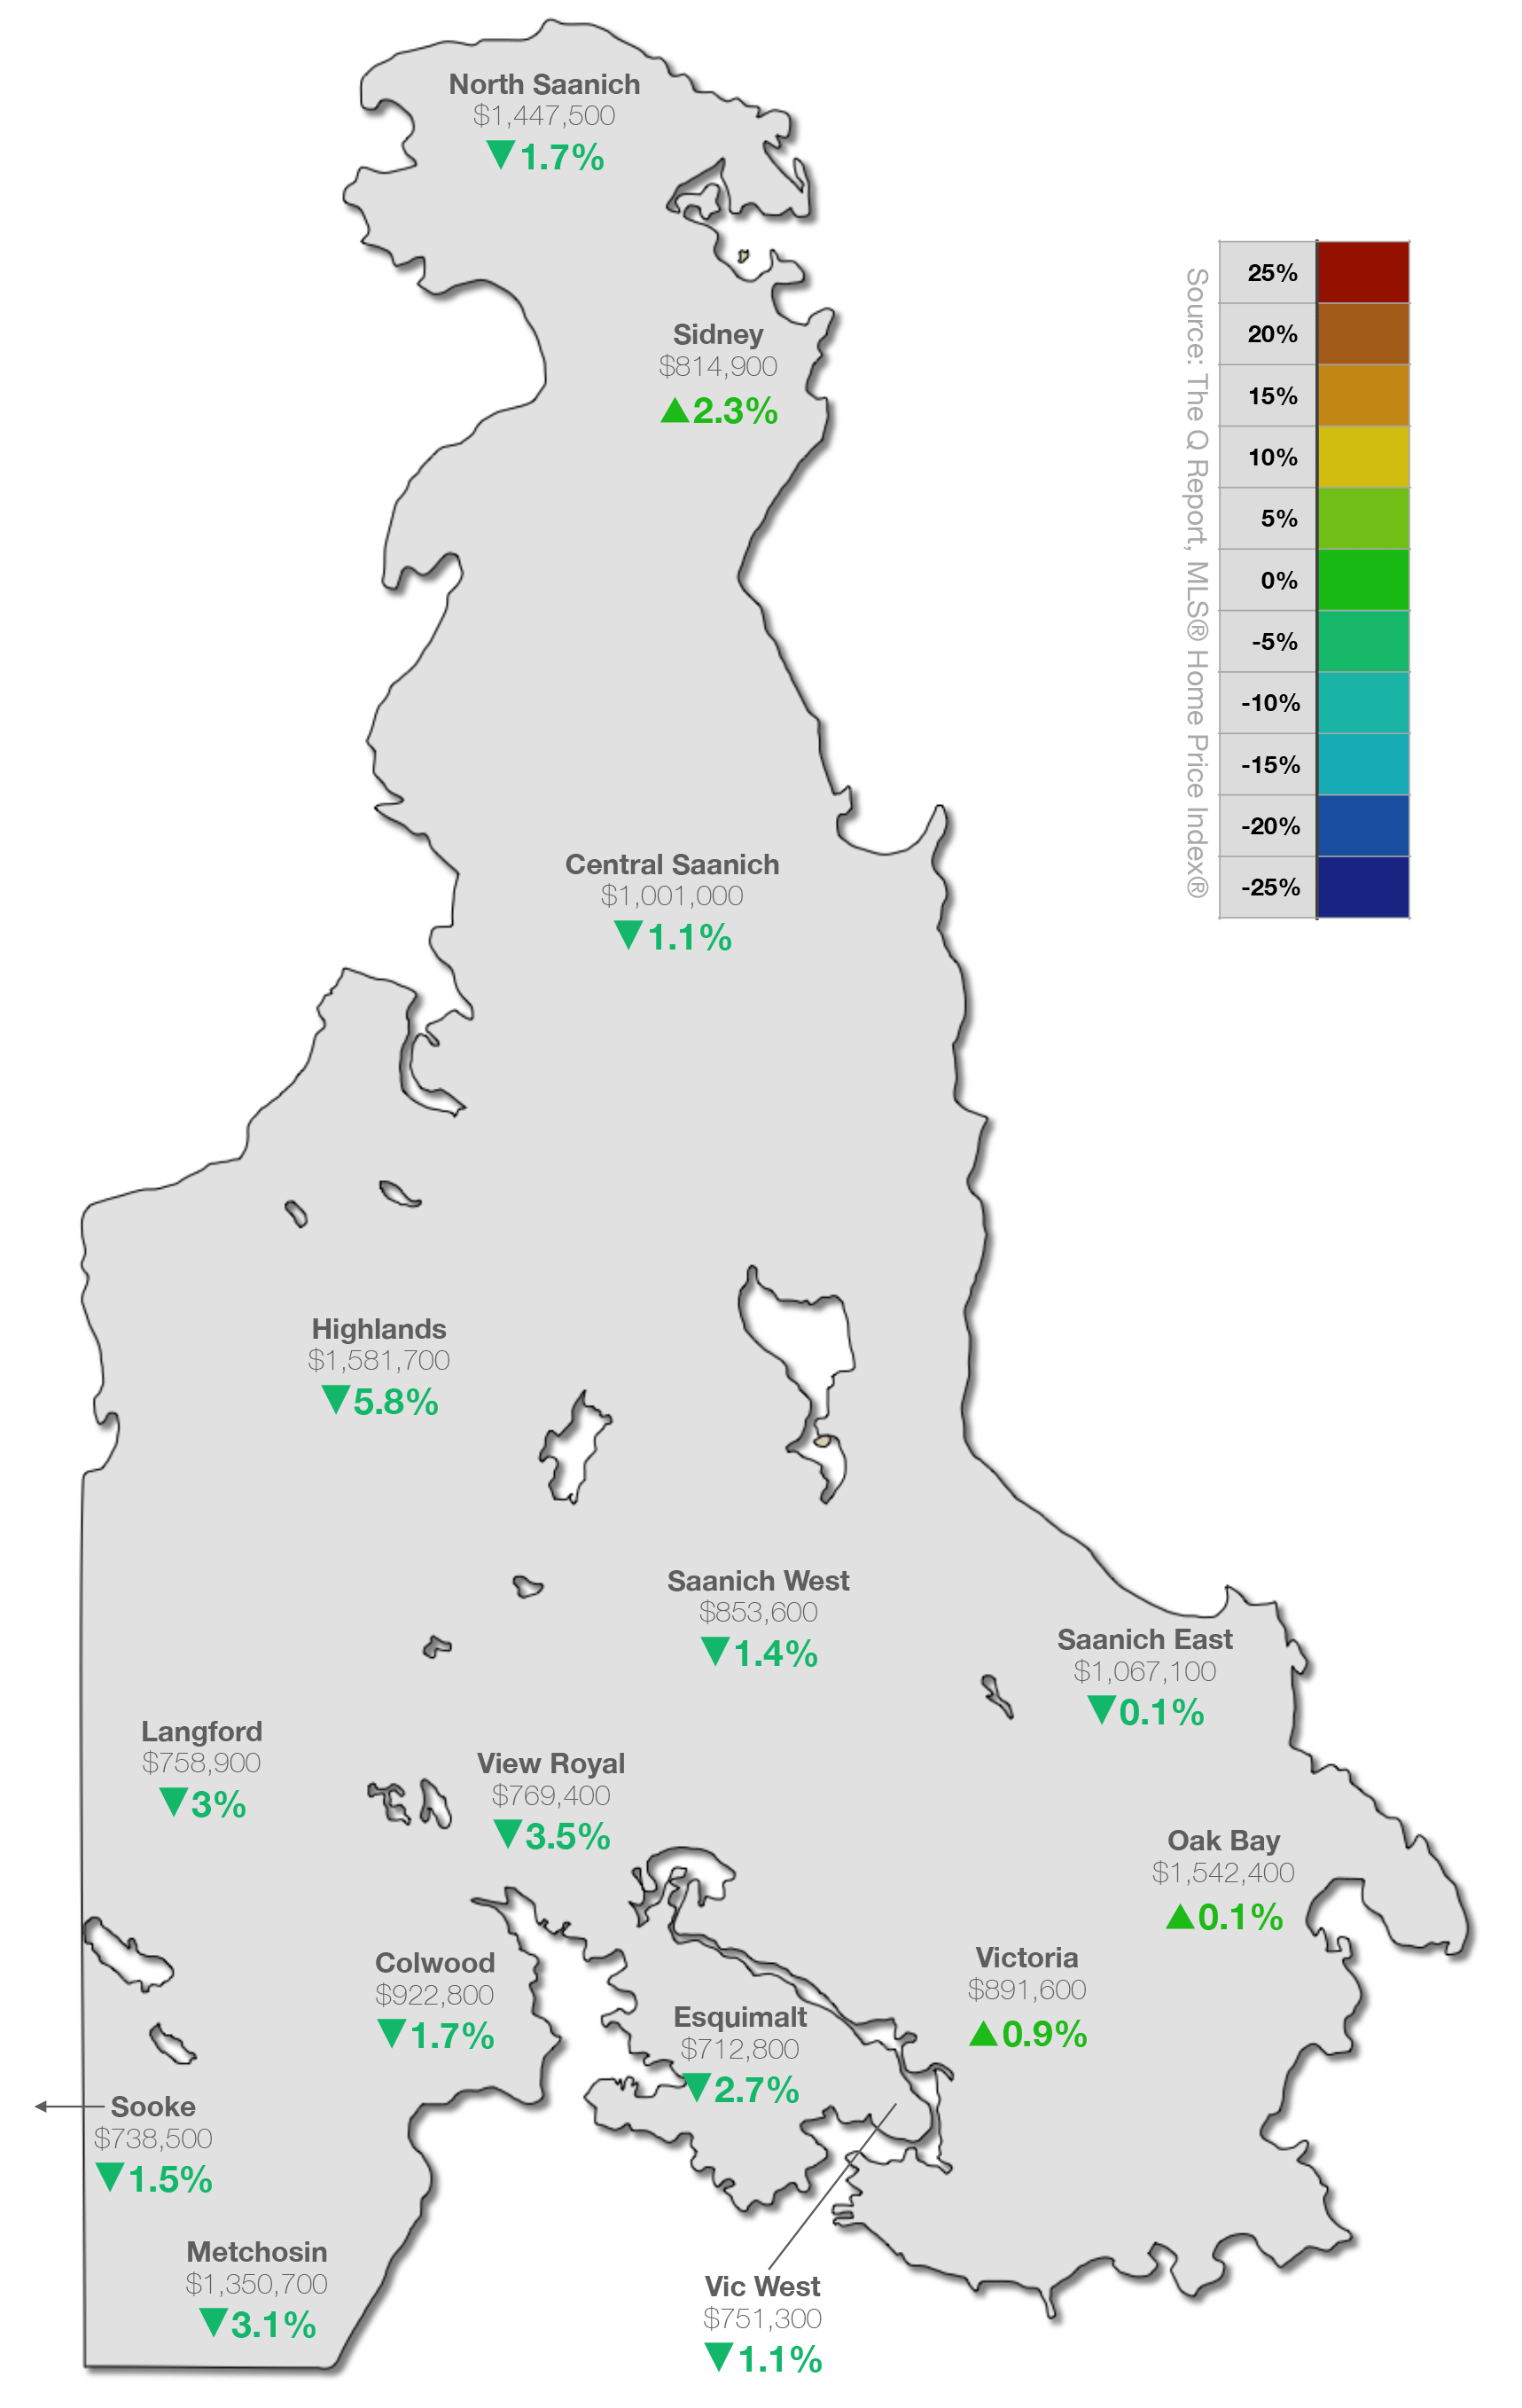
The MLS® Home Price Index® (MLS® HPI®) is purpose-built to gauge neighbourhoods’ home price levels and trends, using more than a decade of sales data and sophisticated statistical models to define a “typical” home based on the value home buyers assign to various attributes on homes that have been bought and sold. These benchmark homes are tracked across localized neighbourhoods and different types of houses. The Q Report’s HPI® trends compares relative regional price movements around Greater Victoria by tracking the HPI® Composite Benchmark Price across 15 districts, comparing Y/Y price changes.
HPI ANALYSIS: Small Moves, Shifting Leaders
The MLS® Home Price Index map for September 2026 shows a market in gentle, broad-based adjustment. Twelve of fifteen districts posted modest year-over-year declines, and every district landed within six percentage points of flat. Just as interesting is how the leaderboard has reshuffled since our Q1 report.
- Bright Spots: Sidney leads all districts with a +2.3% year-over-year gain, followed by Victoria proper at +0.9% and Oak Bay at +0.1%. Oak Bay’s return to positive territory is notable — it posted the steepest decline on the map (-9.6%) just three quarters ago. Saanich East was essentially flat at -0.1%.
- Most Significant Softening: Highlands saw the largest Y/Y HPI Composite decline at -5.8%, followed by View Royal (-3.5%), Metchosin (-3.1%), Langford (-3.0%), and Esquimalt (-2.7%). View Royal is the big mover — it led all districts with a +1.1% gain in Q1.
- The Stable Middle: The remaining districts posted modest declines of -1.1% to -1.7%: Vic West (-1.1%), Central Saanich (-1.1%), Saanich West (-1.4%), Sooke (-1.5%), Colwood (-1.7%), and North Saanich (-1.7%). These are the kinds of small, steady adjustments you expect in a balanced market, not a retreating one.
FORWARD VIEW: Q4 2026
Fall is typically a short, purposeful season in Victoria real estate — motivated buyers and sellers looking to get settled before the holidays — followed by the usual December quiet. Coming out of Q3, we largely expect that pattern to hold, with the market continuing to move at two speeds.
The broader picture will matter more than usual this fall. The Bank of Canada has two more announcements on the calendar, in late October and early December. Most economists expect the Bank to stay on hold through year-end, but it has flagged rising upside risks to inflation, and markets have begun to price in the possibility of a rate hike on the way. Bond markets have already pushed fixed-rate product up nearly half a percentage point. For anyone with a mortgage renewal on the horizon, conditions are worth a conversation now rather than later. Meanwhile, the Canada-U.S. trade dispute shows no sign of a quick resolution, and confidence — not rates — is likely to be the bigger swing factor for local buyers through the end of the year.
For sellers, Q3 is a reminder that the market is paying for realism, not optimism. Widening listing discounts tell us buyers are negotiating harder, and that is especially true in the strata segment, where sellers are competing with appreciably more inventory than a year ago. For buyers, the opportunity is clearest at the entry level: strata prices, price per square foot, and negotiating room are all as favourable as we have seen in years, with genuine buyers market conditions prevailing in a number of areas and segments. Detached and luxury buyers will find steadier pricing and tighter selection — but still have plenty of time to do their homework.
If you are thinking about making a move this year, do you think being well-informed, and having customized data insights would help you make the right decisions along the way? Get in touch now, book a no-hassle, no-obligation meeting and get our market insights working for you. We are only a click or call away.
Do you or someone you know need real estate advice, personalized market insights, a home marketed and sold using the best tools and accurate data? We are available to be your personal resource. Get in touch.
Subscribe, follow us on your favourite social platform, and reach out any time.
Dirk VanderWal & Fergus Kyne
Newport Realty Ltd.
(250) 385-2033 | info@victoriaqreport.com
Notes
All views and opinions expressed in The Q Report are solely those of its authors, Dirk VanderWal and Fergus Kyne, and do not necessarily represent the views or opinions of Newport Realty Ltd. or the Victoria Real Estate Board. Not intended to solicit parties already under contract. E&OE.
Terms
For a list of terms and definitions used in The Q Report, click here.
Data Analysis
The Q Report’s analysis includes listing and sales data exclusively from the Victoria Real Estate Board’s Multiple Listing Service® (MLS®) ‘Core’, ‘Westshore’, and ‘Peninsula’ regions. Data is analyzed for unconditional pending and completed sales that occurred between 2026/07/01 and 2026/09/30 except where specifically noted otherwise.
Data Sources
Axios
Bank of Canada
BC Real Estate Association
Canadian Real Estate Association
Congressional Research Service
Nesto
RateHub
TD Economics
Victoria Real Estate Board