

INTRODUCTION
Happy New Year to you, Q Report Readers, and we warmly welcome you back to another year of the real estate report that REALTORS® read.
What Actually Happened in Victoria’s housing market during the last quarter of 2023? A lot. An unprecedented raft of housing-related legislation met a relatively indifferent market going through the fourth-quarter motions. What lies ahead for 2024 is the question on many minds. Read on for our thoughts — and we encourage you to share with anyone you know who has housing goals on their new years resolution list.
THE EXPLAINER
Spin Cycle
- With housing already one of the top stories in 2023’s news cycle, Q4 was a heyday for the media as BC’s NDP majority government introduced a series of bills aimed at short-term rentals (STRs), up-zoning, and transit-oriented density measures, and passed them all in record time with scarcely a breath of debate in the legislature.
- The Q4 housing market responded to this big news cycle with… indifference?
- A number of small one-bedroom units in buildings that have housed STRs did hit the market in the wake of the legislative announcement, joining an already increased listing inventory facing tepid interest from buyers.
- With borrowing costs continuing to drag on demand across all segments of the market, entry-level product has been hit especially hard as first-time borrowers require six-figure incomes and hefty down payments to get into a one-bedroom in the current financial environment.
- Media pundits and armchair market experts lost no time taking to the press, airwaves, and internet to put their spin on these announcements.
- As an industry, real estate professionals favour the idea of more supply coming to market to meet demand and bring affordability back in line — but the devil is always in the details. Providing municipalities ways to bring in increased ‘missing middle’ type density without being shouted down by local land-use associations is a step in the right direction, but knee-jerk legislation, absent of consultation and debate, opens the door to unintended consequences. And with a tough economic environment for builders, much-needed supply is still years away by any estimate, so don’t expect any amount of legislation to directly move the needle on home prices anytime soon.
- Likewise, legislation on short-term rentals is politically expedient in helping the NDP gain re-election in 2024, as Airbnb operators make great housing market boogeymen, but we expect this legislation on its own to have zero tangible effect on improving availability or affordability of units for rent or purchase. We also find it highly offensive that the owners of these units are having their hard earned equity in both real estate and related businesses arbitrarily slashed by measures that are at best politically motivated virtue signalling.
Your Q Report team was busy with listings and sales right through year-end. If you or anyone you know would benefit from a higher level of professionalism and advice toward their biggest financial decisions guided by the best market data available, why not get in touch today to make your housing goals a reality in 2024?
MARKET BREAKDOWN
Overview


- Year-end counts for Victoria’s market were down nearly 9% from last year’s sales count — the lowest since 2013. This made for a $1B reduction in dollar volume from 2022.
- Interesting side note: The $6B in dollar volume was still approximately double the dollar volume we saw a decade ago when the count of sales was the same. So perhaps more proof positive that local real estate values have doubled in the last ten years. Hope you were in the market!
- With more listings and a moderate pace of sales, it felt like a more balanced market between buyers and sellers in Q4.
- The data showed between 5-6 months of inventory (MOI) through Q4, which is generally indicative of balanced market conditions.
- The gains (and losses) of the past two years have zeroed out as of the end of 2023, with Q4 2023’s benchmark price back where it was in Q4 2021.
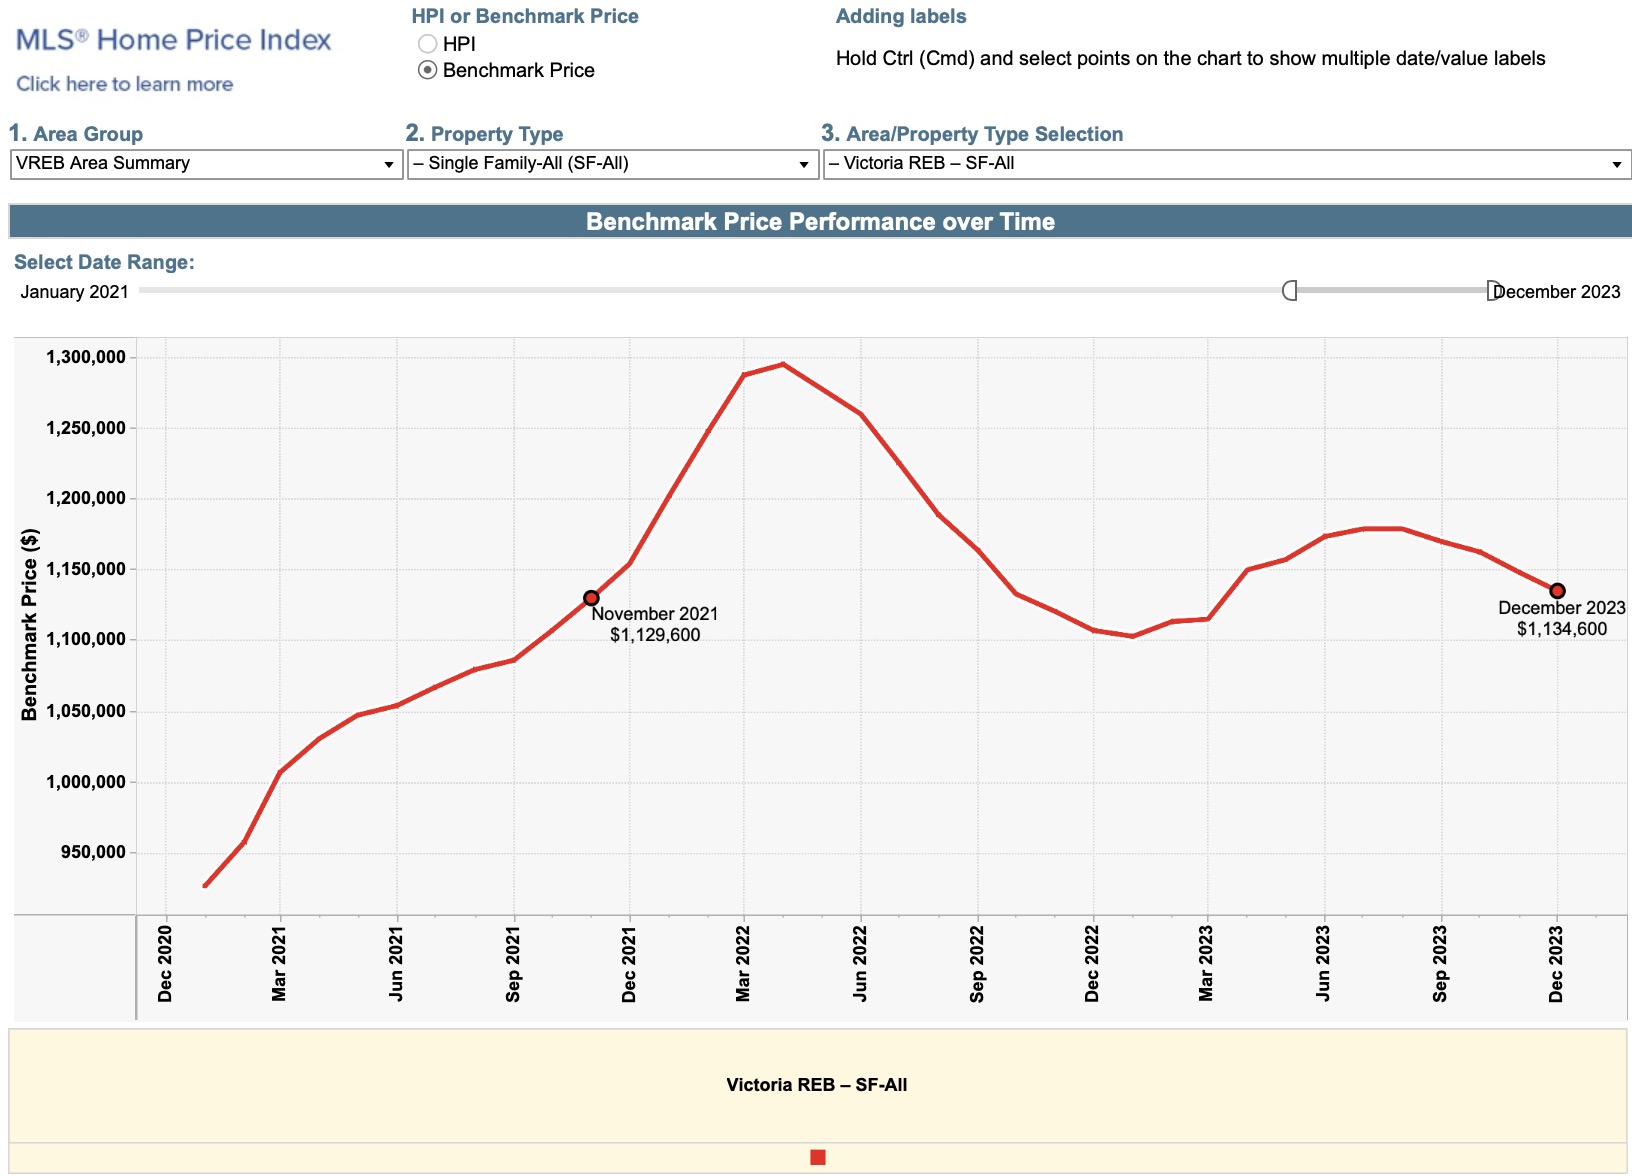
- Except 5-year fixed rates were available below 2.25% in Q4 2021, compared to rates around 3% higher, in the 5.25% range, at the end of 2023.
- This leads us to wonder: where does housing go from here? More on that ahead.
Detached Homes, <$1.5M


- With the lowest number of sales recorded in over a decade, it has been little surprise that pricing metrics slid, with pandemic-era gains now essentially walked back to where they were a few years ago.
- Listing discounts crept back above 4%, repeating last winter’s trend, as high as we have seen in three years.
- We are seeing far fewer multiple offers, fewer sales at list price, and negotiations between sellers and buyers are tending to go on for longer periods of time as buyers continue to eke out deals from sellers who are motivated.
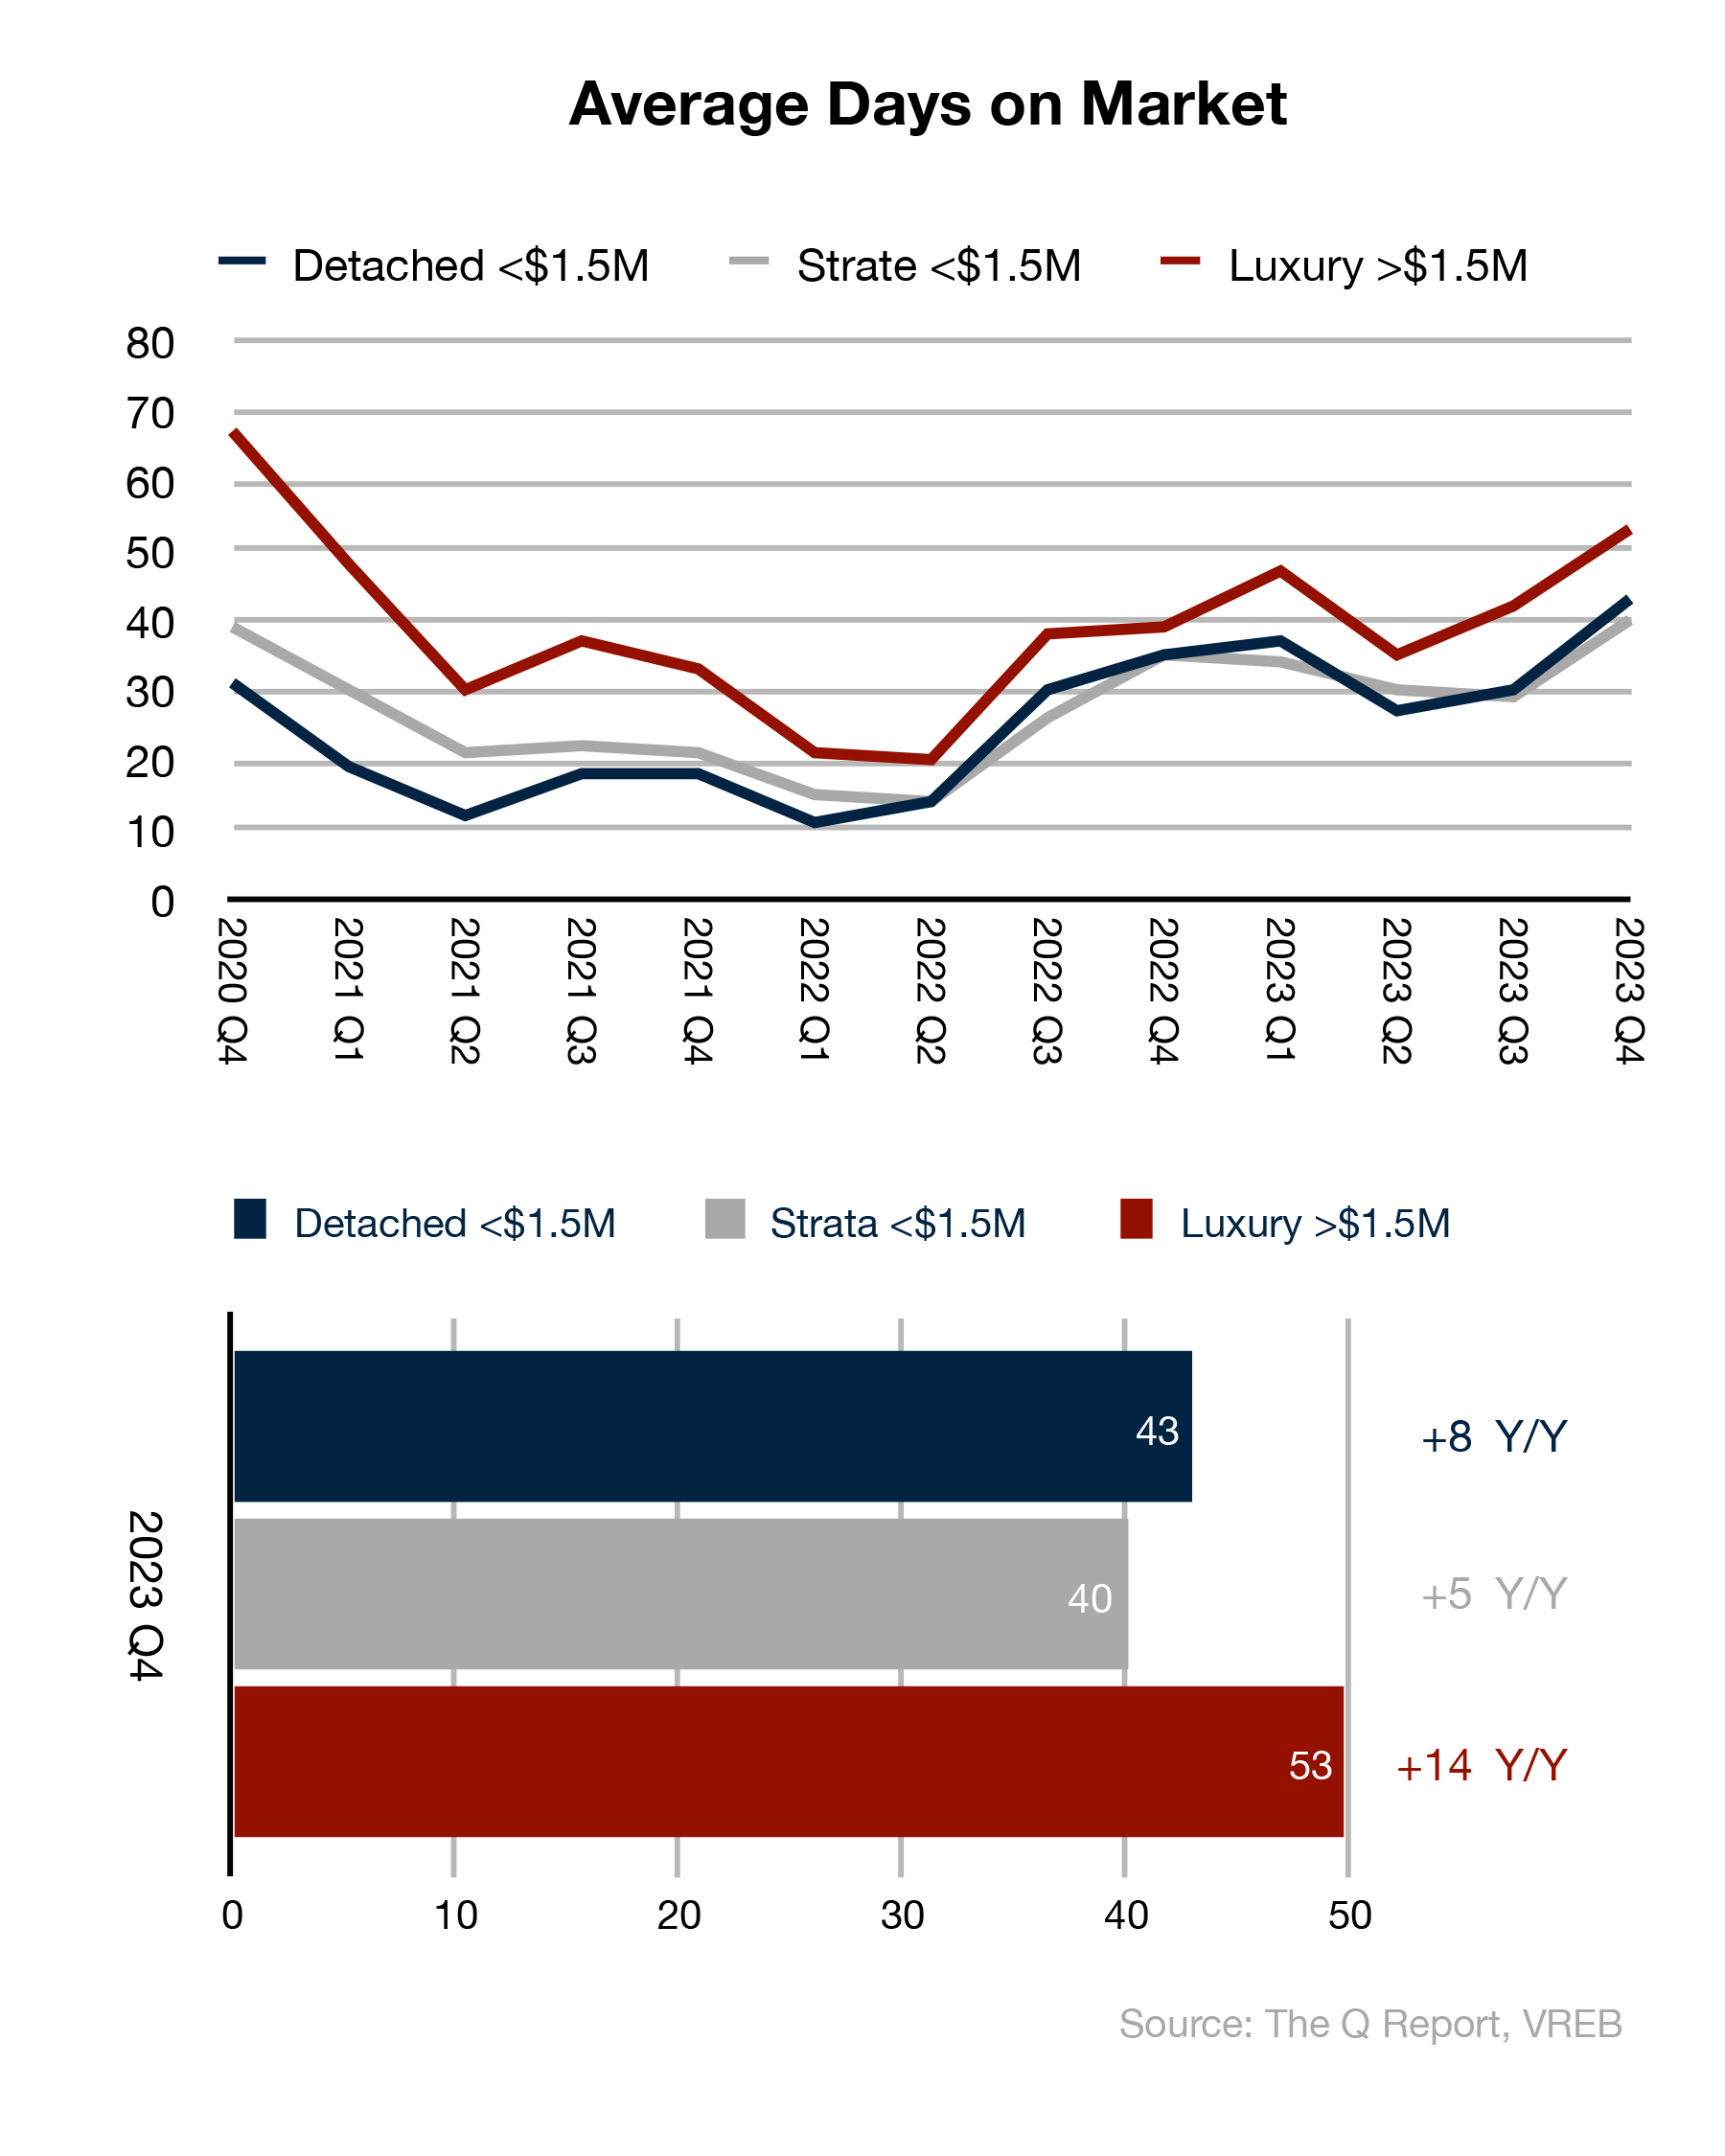
- Market times for detached homes hit a five-year high. Many of our sellers felt the drop in inquiries, showings, and offers. While this is typical for Q4, our statistics show how much deeper it went this winter.
- Active listings slightly reversed their upward trend, which is also typical of market seasonality, but we anticipate the trend to continue to increase as the new year almost always results in more listings coming to market.
Strata Homes, <$1.5M
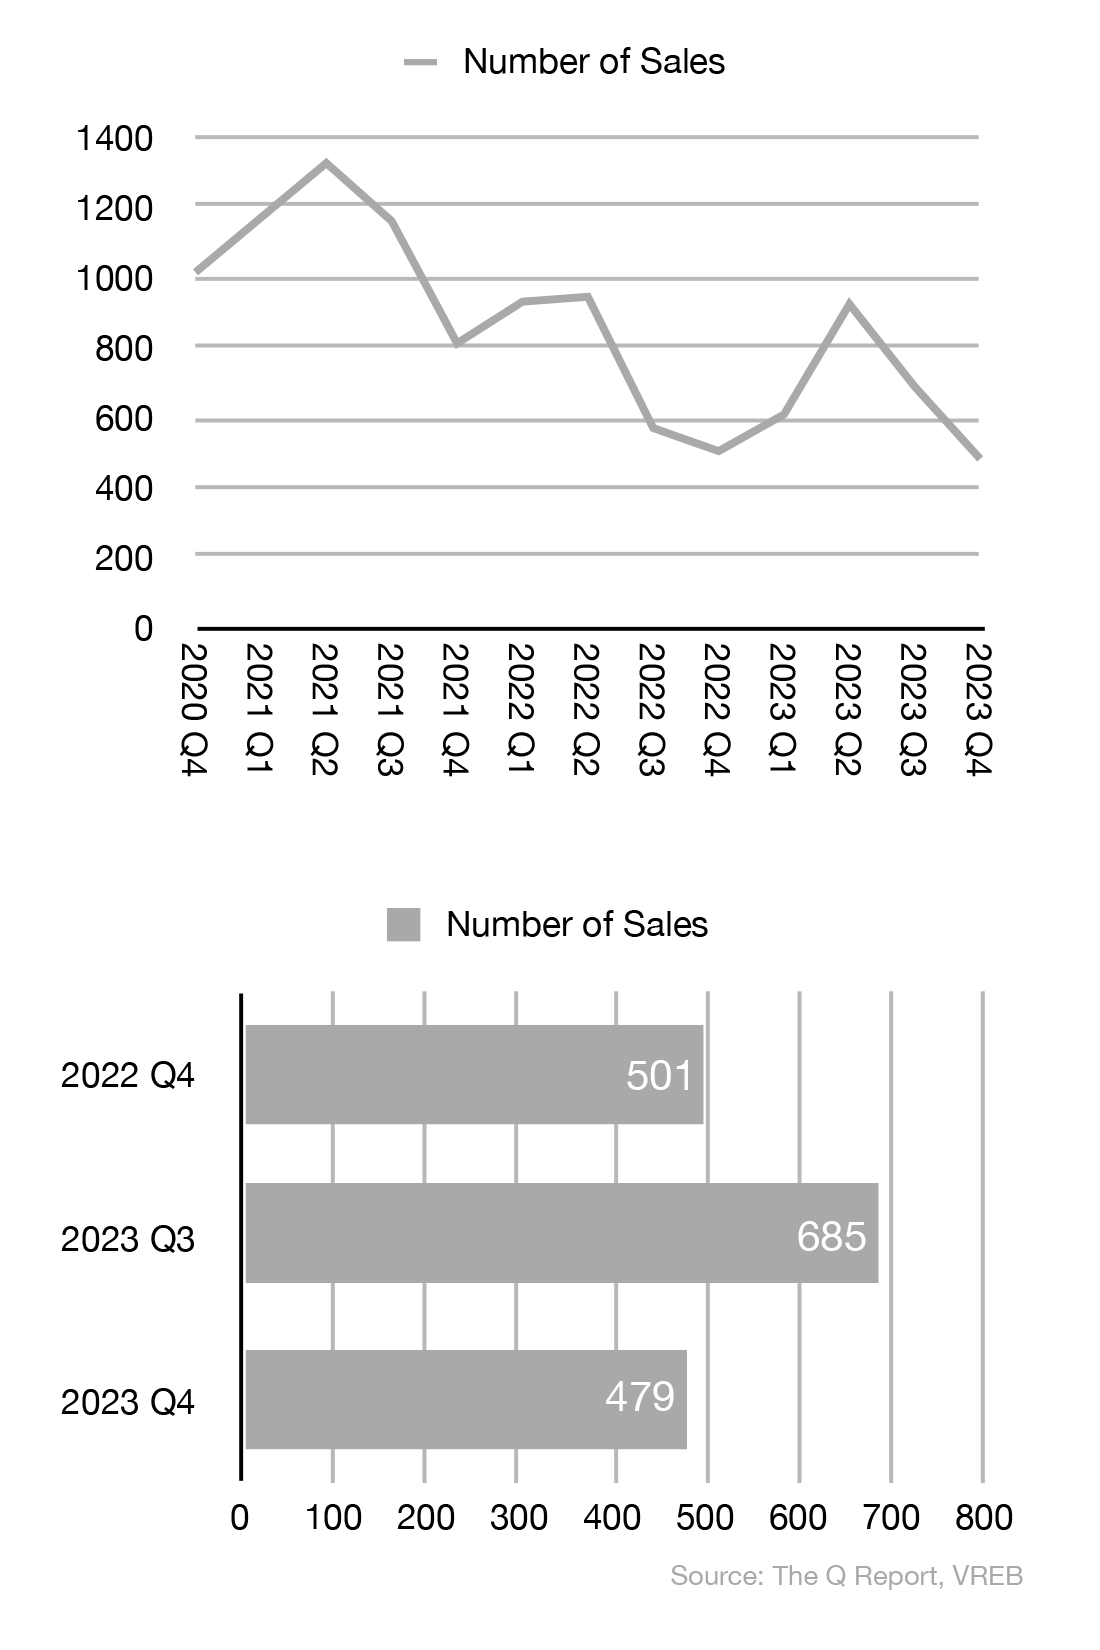


- Since the favourable conditions we saw during the last spring market, sales have been dropping all year long, having now hit a lower point than we have recorded in over a decade.
- Sale prices have also slid back to late-2021 levels. PPSF has remained consistent, and actually increased since the spring, but remains well down from a peak two years ago.
- Market times are back to the higher days on market (DOM) counts harkening back to the depths of the pandemic, when detached homes were in extremely high demand, and multi-family homes bottomed out. We expect the trend of increasing DOM that we have been tracking since mid-2022 to continue into 2024.
- Listing discounts have increased all through 2023, and doubled from Q3 to Q4 — which is connected directly to…
- Active listings — large increases Y/Y and our first time recording an increase from Q3 to Q4 meant sellers had to be more competitive to attract buyers.
Luxury Homes, >$1.5M


- After a decent year in luxury home sales relative to past years, we saw a hard drop in Q3, which was reflective of the broader slowdown.
- Surprisingly, though, median sale price and PPSF moved up throughout the year, including Q4, nearly touching the highs hit in 2021/22. This was also against a trend of increasing inventory.
- Although there were slightly fewer high-end homes to choose from in Q4 compared with Q3, there were definitely still more on the market in the past six months than we have ever seen historically.
- Given the drop in sales and increase in inventory, we were not surprised to see listing discounts and days on market increase as well.
HPI® TRENDS
The MLS® Home Price Index® (MLS® HPI®) is purpose-built to gauge neighbourhoods’ home price levels and trends, using more than a decade of sales data and sophisticated statistical models to define a “typical” home based on the value home buyers assign to various attributes on homes that have been bought and sold. These benchmark homes are tracked across localized neighbourhoods and different types of houses. The Q Report’s HPI® trends compares relative regional price movements around Greater Victoria by tracking the HPI® Composite Benchmark Price across 15 districts, comparing Y/Y price changes.

- Once again, this quarter fell short of the sort of excitement we saw through 2021-22.
- Some munis realized modest Y/Y gains, but this mostly reads like a flat market.
- Notably, the peninsula was up across across the board, especially a whopping 10% annual increase in Central Saanich.
- Even more interesting, every single district’s benchmark price was down from last quarter, averaging around 3%. Sidney only dropped 1.3% Q/Q, but Oak Bay saw a decline of 5.4% in benchmark price from the fall.
WHERE’S IT GOING?
- Economists continue to debate whether Canada has or will officially enter recessionary territory during this cycle, or the oft-touted ‘soft landing’ will emerge. Surprisingly, there is a decent amount of sentiment leaning toward a soft landing at year end.
- BCRA is forecasting MLS® sales and listings to return to around the 10-year average by late 2024, and more balanced market conditions along the way there.
- As a result, we expect prices will most likely likely remain fairly flat through the first half of the year.
- Depending on which way macroeconomic trends end up sticking, the 2024 market could go two ways:
- The Canadian economy continues to soften as elevated interest rates are maintained, dragging on consumer and business spending; sales remain below average, listings increase, and prices remain flat or soften by a few points, or,
- The BoC begins a widely hoped-for campaign of rate cuts, resulting in the market heating up, inventory being sold down, and upward pressure on pricing returning.
- Analysis by BCREA Economics suggests that the lagging pace of sales through 2023 has created a degree of pent-up demand, which could enter the market if rates, prices, or both, become favourable enough.

- Counter to this, the amount of income Canadian households are paying toward debt service is currently at a record high, surpassing pre-pandemic levels and even pre-GFC 2006 levels.

- The supply of listings has improved, but we are beginning 2024 far short of the long-run average.

- So, the biggest trend to watch over the coming quarters will be whether listing inventory is trending up or down.
- Second to that will be interest rates; current bond yield spreads suggest 5-year fixed offerings back below 5% in the new year.
- As of the end of December, markets are pricing in 100bps worth of cuts over the course of 2024, with the first cut predicted in April. Economists are more conservative on their outlook, but still betting on several cuts through the year, with lower rates forecast for 2025.
- Don’t get too excited, though — most economists are still in agreement that the neutral rate is still likely to settle out north of 4.5%.
- If you have been reading The Q Report for a really long time, you’ll remember our coverage of the introduction of the B-20 stress test in late 2018, which is still in place today, requiring borrowers to qualify at 2% above the contract rate on their mortgage. We’ve now come full circle in an interesting way: homeowners who took five-year fixed mortgages in Q1 2019 signed at rates around 3.25%, which meant stress-testing at 5.25%. Those same homeowners renewing today would be walking into almost exactly that 5.25% rate for a 5-year term… for which they were effectively pre-qualified by the stress test.
- Whether taken as a fortunate fluke, or evidence that the rationale behind the stress test is sound, this suggests that those borrowers will not be forced out of their homes by the financial burden of a mortgage renewal.
CONCLUSION
It remains difficult to predict the long-range outlook for our market with a high degree of certainty. However, if you’re wondering how these dynamics will affect your bottom line as they unfold in the year ahead, the time to begin tracking trends is already here. Schedule your no-cost, no-obligation consultation today with the experienced, professional advisors who prepare The Q Report to find out where to focus your attention and determine the most favourable course of action for your unique circumstances, informed by real-time market intelligence tailored to your situation.
We look forward to unpacking the start of the year and analyzing the spring market in earnest with you in Q2.
Do you or someone you know need real estate advice, personalized market insights, a home marketed and sold using the best tools and accurate data? We are available to be your personal resource. Get in touch today.
Subscribe, follow us on your favourite social platform, and reach out any time.
Dirk VanderWal & Fergus Kyne
Newport Realty Ltd.
(250) 385-2033 | info@victoriaqreport.com
Notes
All views and opinions expressed in The Q Report are solely those of its authors, Dirk VanderWal and Fergus Kyne, and do not necessarily represent the views or opinions of Newport Realty Ltd. or the Victoria Real Estate Board. Not intended to solicit parties already under contract. E&OE.
Terms
For a list of terms and definitions used in The Q Report, click here.
Data Analysis
The Q Report’s analysis includes listing and sales data exclusively from the Victoria Real Estate Board’s Multiple Listing Service® (MLS®) ‘Core’, ‘Westshore’, and ‘Peninsula’ regions. Data is analyzed for unconditional pending and completed sales that occurred between 2023/10/01 and 2023/12/31 except where specifically noted otherwise.
Data Sources
BC Real Estate Association
Financial Post
CTV News
NBF Economics
Richardson Wealth Research
Statistics Canada
The Globe and Mail
Times Colonist
The Vancouver Sun
Victoria Real Estate Board